Portfolio Construction
 Direct Indexing: Checking the Box
 60/40 Portfolio Simplicity
 3 Questions for Your Cash Management and Short-Term Investment Allocations
 Do Smaller Asset ETFs Offer a Performance Advantage?
We look at whether nimbler, smaller-asset ETFs take more risks and beat their benchmarks more often versus larger asset ETFs.
 Pricing ETFs: How Premium/Discount Is Calculated
When considering ETFs, know how premium/discount is calculated – and look at other factors.
 Portfolio Construction Fundamentals
Model portfolio manager offers insights on asset allocation, portfolio structure, strategy selection and performance and risk monitoring.
 Investment Portfolio Trends 2023: Looking in the Mirror
A review of more than 200 investment portfolios highlights the benefits of risk-on allocations as inflation fears ease and markets rebound.
 Does the 60/40 portfolio still work?
Decreased volatility, return potential, and bonds in the 60/40 portfolio are analyzed by Harris Associates’ managers.
 Opportunity Knocks in International Stocks
While US stocks are getting all the glory, stocks in the MSCI World Index have also been providing attractive returns – and merit investors’ consideration.
 ETF Tax Efficiency
Explore ETF tax efficiency: Learn from a Natixis ETF Specialist about their tax-efficient investment advantages.
 GQI – Natixis Gateway Quality Income ETF – on NYSE TV
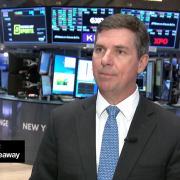
Gateway Investment Advisers CEO Mike Buckius discusses the Natixis Gateway Quality Income ETF (ticker GQI) on the floor of the New York Stock Exchange.
 Quality Matters When Investing
Learn how Gateway Investment Advisers uses a disciplined, proprietary approach to build its high-quality stock portfolios for the GQI ETF.
 Clearing Up the Misconception: ETF Trade Volume vs. Liquidity
With growing investor interest in ETFs, our experts offer a quick primer on evaluating investment liquidity.
 Five Institutional Trends Dominated in 2H 2023
How E&Fs led in performance, why private debt interest soared, and other institutional portfolio trends are detailed.
 Assessing ETF Cost – Understanding the Bid/Ask Spread
Transaction costs for exchange-traded funds (ETFs) are inclusive of a bid/ask spread. Here’s how this figure is defined and its impact for investors.
 3 Thoughts on 2024 ETF Investing Trends
As we close 2023 and its rate hikes, inflation, and geopolitical strife, we consider trends for the 2024 ETF landscape.
 Growth Is Where You Find It: A Look at 2024 Earnings Growth
Portfolio consultant identifies the sectors and industries most likely to experience earnings growth in 2024. Spoiler alert: US technology still looks good.
 2024 Investment Idea: Quality/Growth
Using our proprietary Cyclicality vs. Inflation framework to align portfolio positioning with our economic outlook – lean in on Quality and Growth.
 Bright Spot: Emerging Market Small Cap Stocks
Small emerging market companies have outperformed their large EM counterparts – and the S&P 500® – over the past year.
 Introducing GQI: Natixis Gateway Quality Income ETF
Learn about this high quality equity ETF that uses an option overlay strategy to deliver a robust monthly distribution.
 The Difference a Day Makes: Leaping into 2024
Portfolio consultant offers insight into which tax and investment strategies need to happen before year-end – and others that need to wait for the new year.
 Why We’re (Still) Underweight Securitized Assets
Portfolio consultant compares investments in securitized assets with those in corporate and Treasury securities.
 Portfolio Allocation Trends – Q3 2023
A review of nearly 300 advisor portfolios shows that taking equity risk and staying short on fixed income duration drove top year-to-date portfolio returns.
 Don’t Be Shy About Using Model Portfolios
Using models can give clients a consistent investment experience and free up more time for advisors to provide high level financial advice.
 Portfolio Construction – What Role Should Fixed Income Play?
Liquidity? Diversification? Income? Portfolio consultants discuss a goals-based approach to align the fixed income allocation with investor objectives.
 Investment Committee Overview
Learn about the investment committee that provides capital market views and asset allocation guidance for consulting clients and tactical model portfolios.
 Trading Time for Value
How pursuing certain undervalued companies and incorporating factor analysis makes a difference is explained by Vaughan Nelson portfolio managers.
 Fixed Income Yields and Drivers
Portfolio consultants discuss inflation, interest rates and current bond yields, with a focus on the drivers that could push yields lower or higher.
 Baby Steps: 3 Financial Planning Ideas for Expectant Parents
Three wealth management ideas for getting your financial (rubber) ducks in a row before the sleepless nights begin.
 Psst… Check Out Small Cap Stocks
Valuations, positive momentum, technical support and a likely soft landing are converging to favor small company stocks over the next few months.
 Long Time Horizons Matter for Growth Equity Investing
Head of Loomis Sayles’ Growth Equity Strategies explains why staying focused on a company’s long-term outlook is essential during market volatility.
 Credit Where It’s Due
Robust US growth, strong corporate balance sheets and persistent consumer spending have helped high yield securities and bank loans outperform this year.
 Value Investing Insight with Oakmark Fund Portfolio Managers
Oakmark’s distinct approach to value investing and how it ignores short-term noise to deliver long-term results is explained.
 With Direct Indexing, Process Matters
Kevin Maeda explains how process is a key differentiator between direct index providers, particularly for clients diversifying concentrated stock positions.
 Portfolio Construction: Growth & Cyclical Stocks
Portfolio consultants explain how they align equity investments with their current economic outlook using a growth/cyclical barbell strategy.
 A Concentrated Portfolio May Mean Enhanced Returns
High conviction, deep analysis, and concentrated portfolio construction could mean better returns with actively managed ETFs.
 Moderate Model Portfolio Trends Analysis – Midyear 2023
The best performing investment portfolios in the first half of 2023 had the highest exposure to growth stocks and longer-duration bonds.
 Time to Cash into Stocks?
If you’re keeping your investment money in cash, you’re likely missing out. See three reasons why it may be time to get back into the stock market.
 Five Institutional Investment Trends – Midyear 2023
Recovering institutional investor returns, soaring AI company valuations, and reshuffling real estate sectors due to WFH impact are observed at midyear.
 CE Credit: Evaluating Fixed Income Strategies Through Multiple Lenses
Learn how various types of analysis techniques can help you better evaluate and select the right fixed income strategies for your clients’ portfolios.
 Mid-Cap Stocks – A Sweet Spot for Investors
Want companies with fast-growing earnings, agility, sales growth, and access to capital in your stock portfolio? Don’t forget mid-caps.
 Bank Loan Investors: Look Beyond Rising Rates and Debt Costs
Loomis, Sayles & Company’s Cheryl Stober suggests digging deeper when evaluating the vulnerability of companies with loan-only capital structures.
 Bond Basics: How Interest Rates Affect Bond Yields
Introduction to bond investing, fixed income funds, and how changing interest rates affect prices and yields.
 Traditional Diversification Is Working Again
Stocks and bonds stopped moving in tandem in early December – and that favors duration for bond investors.
 Three Reasons to Stay Invested in Volatile Times
Why panic selling during unsettling times may be one of the worst things long-term investors could do is analyzed over three decades.
 Listen to Our Experts Explain the Framework
Analysis that combines inflation and growth cycle trends may provide a more nuanced way to understand stock market drivers.
 5 Trends in Model Investment Portfolios – Year-End 2022
See which trends influenced financial advisors’ asset allocation decisions in their moderate model portfolios in the second half of 2022.
 Observations on Five Institutional Investing Trends
Foundations and public pensions lost ground in a challenging investment environment. As we enter 2023, indicators suggest elevated return potential.
 Inflation Inaction?
While inflation has surged to 40-year highs, our analysis shows that advisors have been hesitant to allocate to sectors known for inflation resiliency.
 From the Consultants’ Desk: Investment Portfolio Construction Trends at Midyear
US equity exceptionalism sentiment, value, shorter durations, and unicorns are among the asset allocation trends explored.
 5 Midyear Trends in Model Investment Portfolios – Summer 2022
As correlations and inflation spiked in the first half of 2022, the best performing investment portfolios held inflation-protection assets, alternatives – and cash.
 Is This a Good Time to Consider Corporate Bonds?
With yields recently hitting 13-year highs and recession fears growing, are there opportunities in investment grade corporate bonds?
 Institutional Investing Trends Observed at Midyear 2022
Amid the failed diversification of disappointing returns from both stocks and bonds, there are some bright spots in institutional investing trends.
 Bottoms Up: Finding Sustainable Growth in a Global Value Chain
Through a pint of beer, take a look at how Loomis Sayles’ Growth Equity Strategies Team analyzes the beverage industry’s global value chain.
 Using Option Strategies to Help Manage Portfolio Volatility
Learn how option strategies can help manage the volatility of equities and create a smoother ride.
 Inflation Protection: An Equity-Centric View
Historical analysis highlights which equity sectors and strategies fare best when inflation heats up.
 The Art – and Science – of Building Better Model Portfolios
As financial professionals are growing more sophisticated in their use of models, they are raising the bar for portfolio providers.
 Generate Better After-Tax Returns with Direct Indexing
Learn why direct indexing with a separately managed account (SMA) is more tax-efficient than an index fund or ETF.
 Direct Indexing Solutions for Tax-Efficient Diversification
Learn how a direct indexing strategy can help control the tax impact of diversifying a concentrated stock position.
 Tax-Efficient Portfolio Transitions Using Direct Indexing
Discover how direct indexing can help minimize the tax consequences of transitioning portfolio assets to a new account.
 Create Customized Portfolios Using Direct Indexing
See how index portfolios can be customized for ESG (environmental, social, and governance) or strategic investment goals using active screening techniques.
1616208.5.1


