


Opportunity Knocks in International Stocks
From the October 27, 2023 low through February 8, 2024 the S&P 500® has risen just over 20%. A lot has been written about how this has been driven by a handful of large cap US technology and communication services companies. Much of the sales and earnings around the world comes from these companies and the sectors they are in within the US. But what about the rest of the developed world? In fact, there’s been a quiet, broad-based rally outside the US that shows signs of opportunity. Why are these markets rising lately?
The MSCI World Index rose 20% during this same period and, not surprisingly, the largest contributor to returns was the MSCI US component, which makes up 70% of the MSCI World Index and drove 75% of the global index returns since the October low. Like most indexes, the MSCI World is market cap weighted, so the larger a company’s or country’s market capitalization, the larger the weighting in the index. And that methodology is mostly justified, as relative market caps are influenced by companies’ sales and earnings.
Global investment opportunities
But while the US does play a major role in the global economy, there are many other countries and companies around that world that are worth investment consideration. As an investor, it’s important to seek out diversification of return sources. The MSCI ex USA Index has gained 14.8%, with many countries posting 10%–20% rallies during this period – including Japan, France, Germany, Netherlands, Sweden, Israel, Australia and New Zealand – and outpacing the US. If one were to draw the conclusion that the market rally over the past few months and even over the past three-plus years was solely driven by US large cap technology companies, that would be inaccurate.
And from a sector perspective, strong performance from Technology, Industrials, Financials and Consumer Discretionary demonstrated the breadth of these returns (see tables).
The companies in these indexes have demonstrated strong earnings growth over the past three years, with Japan in particular keeping pace with the US. In fact, the Nikkei 225 hit a 35-year high in February, while the S&P 500® and the MSCI Europe both posted new records.
But that’s all water under the bridge. What about global investment opportunities going forward? For the MSCI World, earnings growth is expected to be 8.6% for calendar year 2024 with 10.6% earnings growth expectations for the MSCI US Index and 5.8% for the World ex USA. But there is a fairly wide range between countries. Earnings are expected to grow in the low to mid-teens for countries like Denmark, Sweden, Switzerland, Ireland and Finland. And for 17 of the 23 countries within this index, analysts have positive earnings and sales growth expectations.
At the company level, there are growth and value opportunities both within and outside the US. Of course, the indexes tend to be clustered near each other with the MSCI US having the highest earnings growth and price-to-earnings ratios and Europe with the lowest growth expected and the lowest P/E multiples. But that is not to say that there aren’t plenty of opportunities within the MSCI World ex USA for earnings growth and relatively attractive P/Es. The nearby chart shows earnings growth expectations along with the current P/E ratios based on 2024 estimates.
CFA® and Chartered Financial Analyst® are registered trademarks owned by the CFA Institute.
The views and opinions (as of December 4, 2023) are those of the author(s) and not Natixis Investment Managers or any of its affiliates. This discussion is for educational purposes and should not be considered investment advice.
S&P 500® Index is a widely recognized measure of US stock market performance. It is an unmanaged index of 500 common stocks chosen for market size, liquidity, and industry group representation, among other factors. It also measures the performance of the large cap segment of the US equities market.
MSCI World Index is an unmanaged index that is designed to measure the equity market performance of developed markets. It is comprised of common stocks of companies representative of the market structure of developed market countries in North America, Europe, and the Asia/Pacific Region.
Nikkei 225 Index, short for Japan's Nikkei 225 Stock Average, is the leading and most-respected index of Japanese stocks. It is a price-weighted index comprised of Japan's top 225 blue-chip companies on the Tokyo Stock Exchange.
Diversification does not guarantee a profit or protect against a loss.
All investing involves risk, including the risk of loss. Investment risk exists with equity, fixed income, and alternative investments. There is no assurance that any investment will meet its performance objectives or that losses will be avoided. Investors should fully understand the risks associated with any investment prior to investing.
Although Natixis Investment Managers believes the information provided in this material to be reliable, including that from third party sources, it does not guarantee the accuracy, adequacy, or completeness of such information.
This document may contain references to copyrights, indexes and trademarks that may not be registered in all jurisdictions. Third party registrations are the property of their respective owners and are not affiliated with Natixis Investment Managers or any of its related or affiliated companies (collectively “Natixis”). Such third-party owners do not sponsor, endorse or participate in the provision of any Natixis services, funds or other financial products.
Natixis Advisors, LLC provides advisory services through its division Natixis Investment Managers Solutions which is an affiliate of Natixis Investment Managers, LLC.
The MSCI World Index rose 20% during this same period and, not surprisingly, the largest contributor to returns was the MSCI US component, which makes up 70% of the MSCI World Index and drove 75% of the global index returns since the October low. Like most indexes, the MSCI World is market cap weighted, so the larger a company’s or country’s market capitalization, the larger the weighting in the index. And that methodology is mostly justified, as relative market caps are influenced by companies’ sales and earnings.
Global investment opportunities
But while the US does play a major role in the global economy, there are many other countries and companies around that world that are worth investment consideration. As an investor, it’s important to seek out diversification of return sources. The MSCI ex USA Index has gained 14.8%, with many countries posting 10%–20% rallies during this period – including Japan, France, Germany, Netherlands, Sweden, Israel, Australia and New Zealand – and outpacing the US. If one were to draw the conclusion that the market rally over the past few months and even over the past three-plus years was solely driven by US large cap technology companies, that would be inaccurate.
And from a sector perspective, strong performance from Technology, Industrials, Financials and Consumer Discretionary demonstrated the breadth of these returns (see tables).
Contribution to Return by Country (%)
MSCI World Index 10/27/23–2/8/24
| Average Weight | Total Return | Contribution to Return | 2024 YoY Earnings Growth Estimates | |
|---|---|---|---|---|
| MSCI World | 100.0 | 20.1 | 20.1 | 8.6 |
| United States | 70.2 | 22.4 | 15.5 | 10.6 |
| MSCI World ex United States | 100.0 | 14.8 | 14.8 | 5.8 |
| Japan | 20.4 | 15.2 | 3.0 | 10.7 |
| United Kingdom | 13.4 | 9.1 | 1.3 | -0.6 |
| France | 10.8 | 15.1 | 1.7 | 3.9 |
| Canada | 10.6 | 16.6 | 1.7 | 3.9 |
| Switzerland | 8.9 | 11.1 | 1.0 | 13.1 |
| Germany | 7.6 | 17.4 | 1.3 | 4.2 |
| Australia | 6.6 | 15.5 | 1.0 | -0.7 |
| Netherlands | 4.2 | 34.0 | 1.3 | 9.1 |
| Denmark | 3.0 | 22.6 | 0.7 | 16.5 |
| Sweden | 2.8 | 23.9 | 0.6 | 13.7 |
| Spain | 2.4 | 13.7 | 0.3 | 4.8 |
| Italy | 2.4 | 17.1 | 0.4 | -1.9 |
| Hong Kong | 1.9 | -3.3 | -0.1 | 34.5 |
| Singapore | 1.2 | 5.0 | 0.1 | 0.5 |
| Finland | 0.9 | 8.4 | 0.1 | 11.0 |
| Belgium | 0.8 | 12.9 | 0.1 | 9.6 |
| Israel | 0.6 | 33.1 | 0.2 | -3.8 |
| Norway | 0.6 | -1.7 | -0.0 | 3.1 |
| Ireland | 0.3 | 13.0 | 0.0 | 12.0 |
| Portugal | 0.2 | -0.6 | 0.0 | 3.1 |
| New Zealand | 0.2 | 18.8 | 0.0 | – |
Source: FactSet
Contribution to Return by Economic Sector (%)
GICS – Multisourced 10/27/23–2/8/24
| Average Weight | Total Return | Contribution to Return | 2024 YoY Earnings Growth Estimates | |
|---|---|---|---|---|
| MSCI World | 100.0 | 20.1 | 20.1 | 8.6 |
| United States | 70.2 | 22.4 | 15.5 | 10.6 |
| MSCI World ex United States | 100.0 | 14.8 | 14.8 | 5.8 |
| Financials | 20.7 | 14.0 | 2.9 | 5.6 |
| Industrials | 15.9 | 21.3 | 3.2 | 3.1 |
| Health Care | 11.6 | 12.0 | 1.4 | 8.1 |
| Consumer Discretionary | 11.1 | 18.6 | 2.0 | 6.5 |
| Consumer Staples | 9.0 | 8.0 | 0.8 | 7.8 |
| Information Technology | 8.6 | 37.2 | 2.9 | 9.9 |
| Materials | 7.8 | 8.2 | 0.7 | 10.3 |
| Energy | 5.9 | -2.3 | -0.1 | -4.7 |
| Communication Services | 3.9 | 13/1 | 0.5 | 22.1 |
| Utilities | 3.4 | 5.6 | 0.2 | 3.8 |
| Real Estate | 2.2 | 14.6 | 0.3 | 13.1 |
Source: FactSet
Comparative Total Returns, Earnings Per Share and P/E Ratios of Global Indexes (1/1/20–1/31/24)
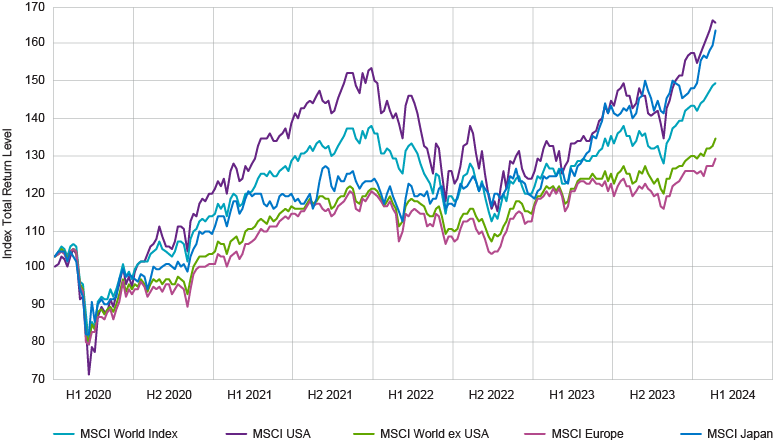
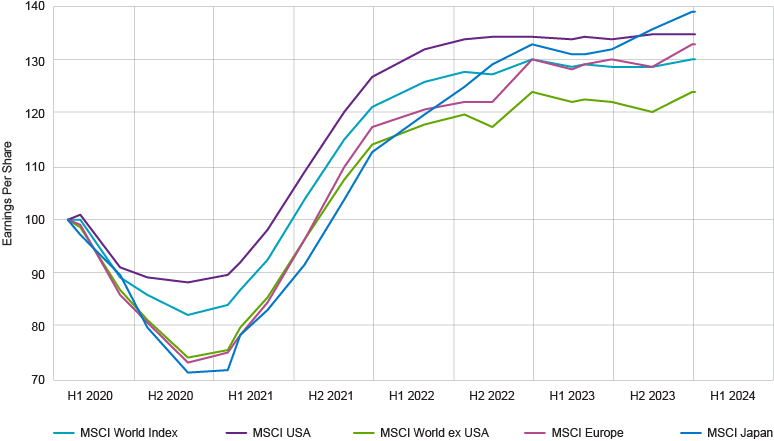
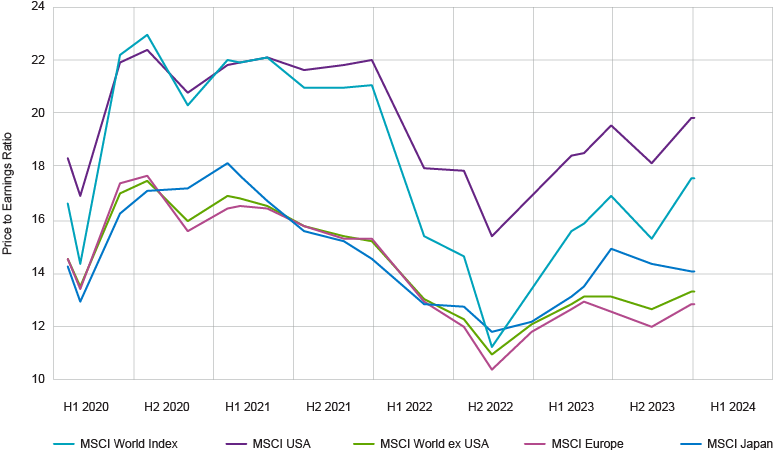
Source: FactSet
But that’s all water under the bridge. What about global investment opportunities going forward? For the MSCI World, earnings growth is expected to be 8.6% for calendar year 2024 with 10.6% earnings growth expectations for the MSCI US Index and 5.8% for the World ex USA. But there is a fairly wide range between countries. Earnings are expected to grow in the low to mid-teens for countries like Denmark, Sweden, Switzerland, Ireland and Finland. And for 17 of the 23 countries within this index, analysts have positive earnings and sales growth expectations.
At the company level, there are growth and value opportunities both within and outside the US. Of course, the indexes tend to be clustered near each other with the MSCI US having the highest earnings growth and price-to-earnings ratios and Europe with the lowest growth expected and the lowest P/E multiples. But that is not to say that there aren’t plenty of opportunities within the MSCI World ex USA for earnings growth and relatively attractive P/Es. The nearby chart shows earnings growth expectations along with the current P/E ratios based on 2024 estimates.
Similar Earnings Growth & Valuation Opportunities Throughout the World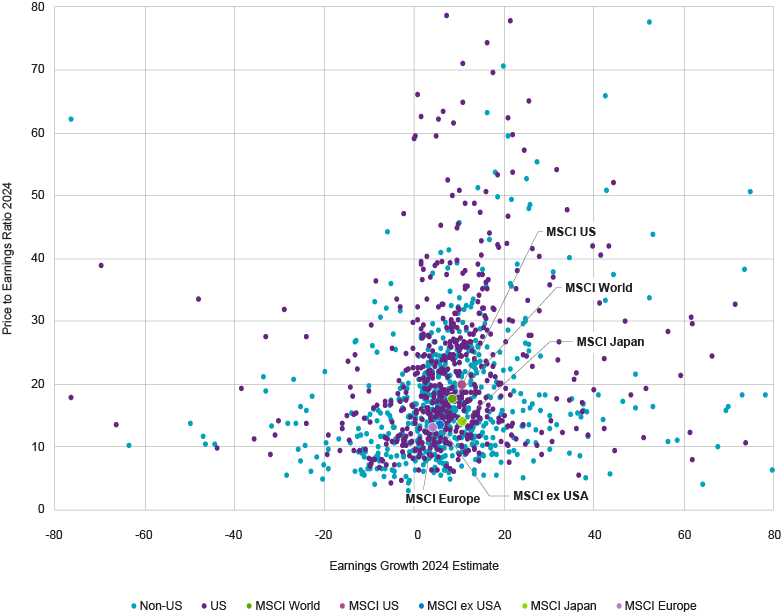
Source: FactSet
The views and opinions (as of December 4, 2023) are those of the author(s) and not Natixis Investment Managers or any of its affiliates. This discussion is for educational purposes and should not be considered investment advice.
S&P 500® Index is a widely recognized measure of US stock market performance. It is an unmanaged index of 500 common stocks chosen for market size, liquidity, and industry group representation, among other factors. It also measures the performance of the large cap segment of the US equities market.
MSCI World Index is an unmanaged index that is designed to measure the equity market performance of developed markets. It is comprised of common stocks of companies representative of the market structure of developed market countries in North America, Europe, and the Asia/Pacific Region.
Nikkei 225 Index, short for Japan's Nikkei 225 Stock Average, is the leading and most-respected index of Japanese stocks. It is a price-weighted index comprised of Japan's top 225 blue-chip companies on the Tokyo Stock Exchange.
Diversification does not guarantee a profit or protect against a loss.
All investing involves risk, including the risk of loss. Investment risk exists with equity, fixed income, and alternative investments. There is no assurance that any investment will meet its performance objectives or that losses will be avoided. Investors should fully understand the risks associated with any investment prior to investing.
Although Natixis Investment Managers believes the information provided in this material to be reliable, including that from third party sources, it does not guarantee the accuracy, adequacy, or completeness of such information.
This document may contain references to copyrights, indexes and trademarks that may not be registered in all jurisdictions. Third party registrations are the property of their respective owners and are not affiliated with Natixis Investment Managers or any of its related or affiliated companies (collectively “Natixis”). Such third-party owners do not sponsor, endorse or participate in the provision of any Natixis services, funds or other financial products.
Natixis Advisors, LLC provides advisory services through its division Natixis Investment Managers Solutions which is an affiliate of Natixis Investment Managers, LLC.
6420744.1.1
 Direct Indexing: Checking the Box
 Tax Management Update – Q1 2024