


Clearing Up the Misconception: ETF Trade Volume vs. Liquidity
A client recently expressed interest in the Natixis Loomis Sayles Focused Growth (LSGR) ETF* but had concerns about its low trading volume. In our experience this is the most common, but easily addressed, misconception about ETF liquidity.
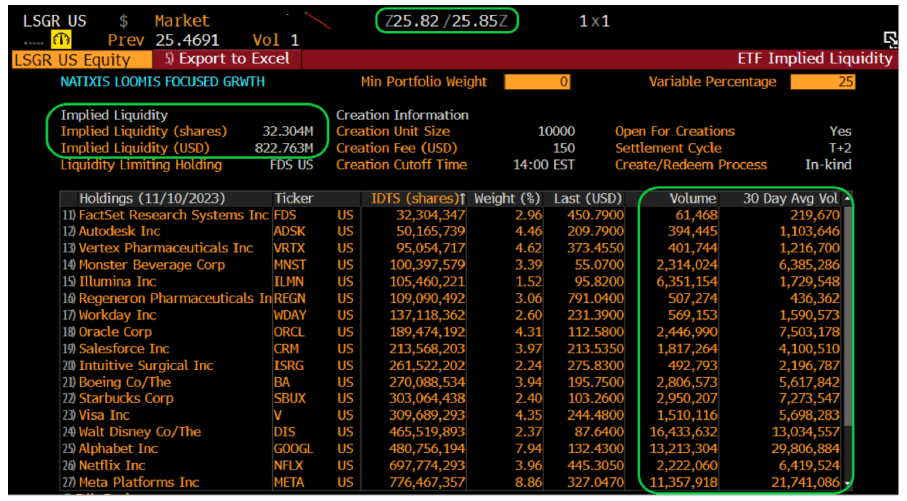
Indeed, LSGR has a 30-day average trading volume (ADV) of roughly 100 shares on the secondary market (as of 11/10/2023). This low average trade volume can be common in relatively new ETFs like LSGR, which launched in June 2023. However, an investor could buy up to roughly 30 million shares (over $800 million notional value) at the current market quote or better. How is this possible?
Where’s the Liquidity?
As illustrated below, ETF liquidity is determined by trading volume of all underlying holdings in the portfolio creation basket. Based on LSGR’s holdings and weights (as of 11/10/2023), market makers1 would be willing to facilitate new buy orders up to 32 million shares at the current National Best Bid/Offer2 (NBBO) asking price of $25.85 or lower, depending on trade size. This equates to a notional value of over $820 million. This secondary market trade would likely flow into the primary market as new shares would need to be created to meet this outsized demand.
 Source: Bloomberg/Natixis ETF Capital Markets Group. Included for illustrative purposes only.
“Implied liquidity” is a measure of an ETF’s potential trading volume based on its components and liquidity profile. In the example above, FactSet Research Systems Inc. (FDS) would be considered the least liquid basket holding, per its ADV. The least liquid ETF holding typically determines how much of the ETF could be bought or sold on a given day without causing undue friction3 in the underlying security prices. Remember, when ETF units are created or redeemed in a standard in-kind primary market order, the full basket of underlying holdings will be included in the transaction.
Executing an ETF Trade
In our example a very large buy could be fully executed at the market quote of $25.85 or lower (even if only 100 shares are being offered at the NBBO on-screen). Economies of scale play a key role as liquidity providers’ fixed costs to create/redeem ETF shares become a smaller percentage of the overall transaction for large trades. Typically, the best possible execution price on these large purchases is the intraday net asset value (iNAV)4, as liquidity providers would ideally avoid selling shares for less than the underlying components’ actual worth.
To optimize trade execution, we suggest using limit orders5 instead of market orders for on-screen trading. For large lot trades (over roughly 2,000 shares), financial advisors can consult with an ETF issuer’s capital markets team for advice on best practice or contact their dedicated broker/dealer ETF block trading desk to facilitate the order.
Let’s test our theory by considering two real world Natixis ETF transactions.
ETF Example 1: A Large Lot Purchase
A large block purchase of 199,000 shares of LSGR was executed on the launch date (6/29/2023) at a share price of $25.04 for a total value of $4.98 million. As it was the first trading day, there was minimal secondary market volume and limited shareholders. However, since ETF shares can be created on demand, the order was executed at a price 1 cent above the iNAV ($25.03) and 3 cents below the NBBO ask ($25.07) at the time of the trade. This amounts to cost savings of $5,970 for executing a large block order versus trading at on-screen levels.
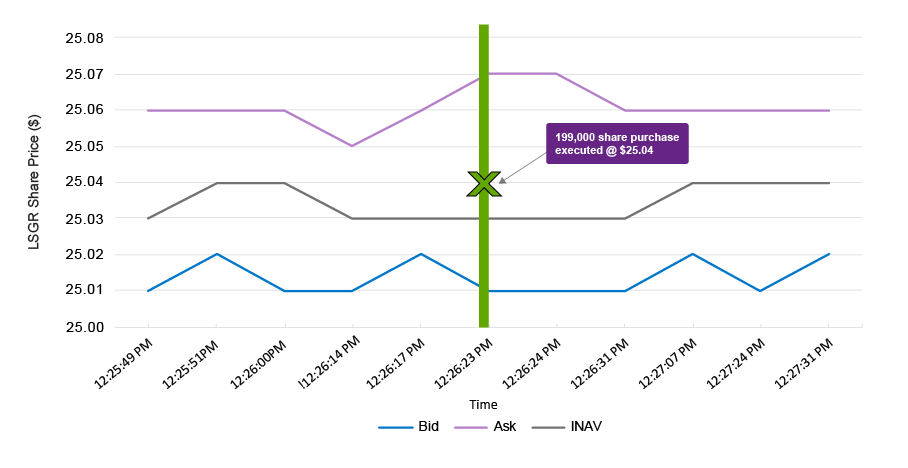
Source: Bloomberg/Natixis ETF Capital Markets Group
ETF Example 2: A Large Lot Sale
Would the trading execution on ETFs of similar size and average trade volume be equally efficient for a sell order? The answer is yes. For example, on 9/1/2023, a large Natixis Vaughan Nelson Mid Cap ETF (VNMC) block sale of 136,000 shares was executed at $29.88 for a total value of $4.06 million. At the time, the 30-day ADV for VNMC was only about 1,000 shares. Once again, given that ETF shares can be redeemed directly by a liquidity provider, this order was executed at 1 cent below the iNAV and 3 cents above the NBBO bid at the time of the trade. This amounts to cost savings of $4,080 for executing a large block order as opposed to trading at on-screen levels.
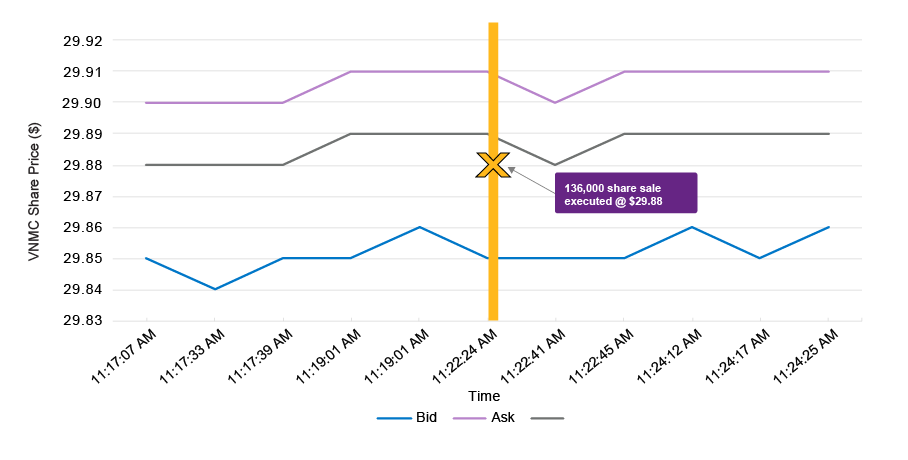
Source: Bloomberg/Natixis ETF Capital Markets Group
ETF: Demand, Not Supply
In summary, the ETF secondary market activity can be viewed as the demand for a product – but not the supply – because ETF shares can be continuously created from the underlying portfolio by market makers. This is unlike a normal stock with a finite number of shares outstanding. Therefore, in contrast to single stocks, investors should not view the average daily trading volume as a barometer for how much liquidity an ETF actually has.
When placing a trade, investors have a wide range of tools and resources at their disposal to enhance best execution, including contacting the ETF issuer’s Capital Markets Desk and the broker/dealer’s ETF block trading desk.
Learn More
Contact us if we can help you with this or any other trading strategy.
Natixis ETF Capital Markets Desk: 800-458-7452 or This email address is being protected from spambots. You need JavaScript enabled to view it.
2 The National Best Bid and Offer (NBBO) is a quote that reports the highest current bid price and lowest current ask (offered) price in a security, sourced from among all available exchanges or trading venues. The NBBO, therefore, represents the tightest current composite bid-ask spread in a security.
3 Trade friction refers to the share price movement directly caused by trade activity.
4 The intraday net asset value (iNAV) provides an intraday indicative value of an ETF based on the market values of its underlying constituents.
5 A limit order is an order placed with a broker or brokerage service to buy or sell a set amount of a financial instrument at a specified price or better. Unlike a market order, it may not be executed if the price set by the investor cannot be met during a certain time period.
* This ETF is different from traditional ETFs – traditional ETFs tell the public what assets they hold each day; this ETF will not. This may create additional risks. For example, since this ETF provides less information to traders, they may charge you more money to trade this ETF's shares. Also, the price you pay to buy or sell ETF shares on an exchange may not match the value of the ETF's portfolio. These risks may be even greater in bad or uncertain markets. See the ETF prospectus for more information.
This material is provided for informational purposes only and should not be construed as investment advice. The views and opinions contained herein reflect the subjective judgments and assumptions of the authors only and do not necessarily reflect the views of Natixis Investment Managers, or any of its affiliates. There can be no assurance that developments will transpire as forecasted, and actual results may vary.
Investing involves risk, including the risk of loss. Before investing, consider the fund’s investment objectives, risks, charges, and expenses. Visit im.natixis.com for a prospectus or a summary prospectus containing this and other information. Read it carefully.
ETF General Risk: ETFs trade like stocks, are subject to investment risk, and will fluctuate in market value. Unlike mutual funds, ETF shares are not individually redeemable directly with the Fund and are bought and sold on the secondary market at market price, which may be higher or lower than the ETF's net asset value (NAV). Transactions in shares of ETFs will result in brokerage commissions, which will reduce returns.
ALPS Distributors, Inc. is the distributor for the Natixis Loomis Sayles Focused Growth ETF and the Natixis Vaughan Nelson Mid Cap ETF. Natixis Distribution, LLC is a marketing agent. ALPS Distributors, Inc. is not affiliated with Natixis Distribution, LLC.
This material may not be redistributed, published, or reproduced, in whole or in part. Although Natixis Investment Managers believes the information provided in this material to be reliable, including that from third party sources, it does not guarantee the accuracy, adequacy or completeness of such information.
This document may contain references to copyrights, indexes and trademarks that may not be registered in all jurisdictions. Third party registrations are the property of their respective owners and are not affiliated with Natixis Investment Managers or any of its related or affiliated companies (collectively “Natixis”). Such third party owners do not sponsor, endorse or participate in the provision of any Natixis services, funds or other financial products.
Provided by Natixis Distribution, LLC, 888 Boylston St., Boston, MA 02199. Natixis Investment Managers includes all of the investment management and distribution entities affiliated with Natixis Distribution, LLC and Natixis Investment Managers S.A. Natixis Advisors, LLC provides advisory services through its division Natixis Investment Managers Solutions. Advisory services are generally provided with the assistance of model portfolio providers, some of which are affiliates of Natixis Investment Managers, LLC.
6142580.1.1
 3 Questions for Your Cash Management and Short-Term Investment Allocations
 Do Smaller Asset ETFs Offer a Performance Advantage?
 Credit Market Outlook: Solid Fundamentals and FOMO