


Why We’re (Still) Underweight Securitized Assets
Securitized yields look compelling in absolute terms – no doubt about it. Mortgage-backed securities (MBS) yields above 5% haven’t been available since the Global Financial Crisis. But that’s largely true of most areas of fixed income right now. And while it’s important to allocate in a relative value context, a simple comparison of yields obscures the fact that investing in MBS today is quite different from investing over the past several years.
Mortgage rates have spiked so significantly that people are staying in their homes longer and avoiding selling in fear of giving up post-Covid interest rates in the 2%–3% range. They’re also not refinancing. As this prepayment risk has vanished, MBS duration has spiked. It’s now higher than broad Treasuries and within striking distance of corporates.
To account for the unusual duration profile today vs. history, we believe a better way to think about risk-adjusted return prospects is spread per unit of duration. How much additional yield over Treasuries do I get for every year of duration that I take? As the chart shows, the spread per unit of duration between MBS and corporates was nearly identical back in 2021. Since then, the combination of higher duration on MBS and higher spreads on corporates has pushed this metric strongly in favor of corporates.
But corporates should outyield mortgages, given that they are lower in credit quality with no explicit or implicit government guarantee. So what about other more return-seeking securitized sectors like CMBS (commercial mortgage-backed securities) and ABS (asset-backed securities)? Thanks to shorter loan terms and – in the case of CMBS – prepayment penalties, these two categories don’t fluctuate as much in duration. Both have durations below MBS.
ABS (2.7 years duration) compares similarly to 1-to-5-year corporates (2.6 years duration) – and a spread per unit of duration comparison favors corporates.
But consider the backdrop for commercial mortgages. CMBS spreads are slowly approaching Covid-era levels, a bizarre combination of higher-quality securities trading with flat or even tighter spreads while lower-quality spreads go wider than Covid highs. If that overall spread looks appealing, are you bullish on lower-quality commercial properties? The office sector has gotten smoked over the past two years and – perhaps somewhat of a silver lining – now represents a smaller portion of the asset class than it has over the past several years.
In addition to the lower weight in the index due to price action, we’ve also started to see a structural shift away from office in new issuance. In the prior five years, CMBS deals had more average exposure to office (33%) than any other sector. For 2023 vintages, office exposure has declined to around 21%. So it’s not as bad as it was a couple of years ago. Also, investors in CMBS are getting more diversified exposure to retail, residential, hotel, industrial and data storage properties. But the bottom line is you’re getting paid only a tiny bit more than corporates – and still taking on some pretty meaningful risk for doing so.
Convexity Now Positive for MBS
Another dynamic at play with securitized returns is convexity. MBS is typically a negative convex asset class, which just means that prices rise more slowly as yields fall, due to early prepayment of principal. As prepayment risk has diminished, MBS is actually demonstrating positive convexity, meaning prices rise faster as yields fall. So, when you consider a potential falling rate environment in 2024, one could make the case that MBS will more fully participate in the duration math of lower yields and keep pace with corporate bonds, while staying higher up in quality.
But we don’t think that scenario is as likely for two reasons. First, MBS convexity, while positive, is still lower than Treasuries and corporates. Second, new mortgage origination has been so constrained that you could see a pop in activity even if rates fall just a little. After seeing mortgage rates above 8%, maybe a 6-handle is enough for that first-time homebuyer to pounce. We shouldn’t need mortgage rates back in the 3s to see transactional volume normalize. That pent-up demand could manifest much sooner, flipping convexity back to negative and providing a ceiling on upside return potential.
One slight boost to securitized investors: New MBS issuance is likely to be constrained even further in the short term, as home sales slow throughout the winter months. If yields continue to fall throughout the winter, and economic data holds up, mortgages are likely to slightly outperform Treasuries. Additionally, the various dislocations that exist between securities (e.g. new mortgages vs. old mortgages, high quality vs. low quality CMBS) provide a nice backdrop for active management to outperform passive benchmarks.
Bottom Line: Corporates Remain More Attractive
Investors with too much capital in cash or Treasuries could certainly benefit from an allocation to securitized, in order to participate more broadly in a falling rate environment. But the case for meaningful outperformance – the type of outperformance that would make you regret not loading up on securitized – remains pretty challenging. For diversified investors, yield-seeking investors, return-seeking investors, and investors looking to tactically allocate toward relative value… if you are in any of those categories… we still like corporates.
CFA® and Chartered Financial Analyst® are registered trademarks owned by the CFA Institute.
The views and opinions (as of November 20, 2023) are those of the author(s) and not Natixis Investment Managers or any of its affiliates. This discussion is for educational purposes and should not be considered investment advice.
All investing involves risk, including the risk of loss. Investment risk exists with equity, fixed income, and alternative investments. There is no assurance that any investment will meet its performance objectives or that losses will be avoided. Investors should fully understand the risks associated with any investment prior to investing.
Although Natixis Investment Managers believes the information provided in this material to be reliable, including that from third party sources, it does not guarantee the accuracy, adequacy, or completeness of such information.
This document may contain references to copyrights, indexes and trademarks that may not be registered in all jurisdictions. Third party registrations are the property of their respective owners and are not affiliated with Natixis Investment Managers or any of its related or affiliated companies (collectively “Natixis”). Such third-party owners do not sponsor, endorse or participate in the provision of any Natixis services, funds or other financial products.
Natixis Advisors, LLC provides advisory services through its division Natixis Investment Managers Solutions which is an affiliate of Natixis Investment Managers, LLC.
Mortgage rates have spiked so significantly that people are staying in their homes longer and avoiding selling in fear of giving up post-Covid interest rates in the 2%–3% range. They’re also not refinancing. As this prepayment risk has vanished, MBS duration has spiked. It’s now higher than broad Treasuries and within striking distance of corporates.
Duration Comparison: MBS vs. Corporate Bonds and Treasuries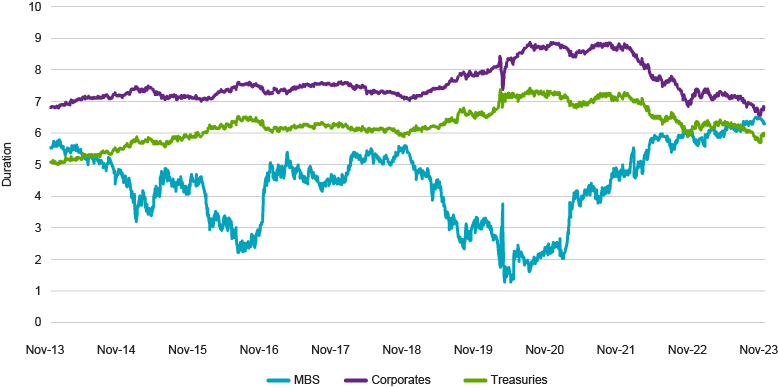
Source: FactSet
To account for the unusual duration profile today vs. history, we believe a better way to think about risk-adjusted return prospects is spread per unit of duration. How much additional yield over Treasuries do I get for every year of duration that I take? As the chart shows, the spread per unit of duration between MBS and corporates was nearly identical back in 2021. Since then, the combination of higher duration on MBS and higher spreads on corporates has pushed this metric strongly in favor of corporates.
Spread Per Unit of Duration: MBS vs. Corporate Bonds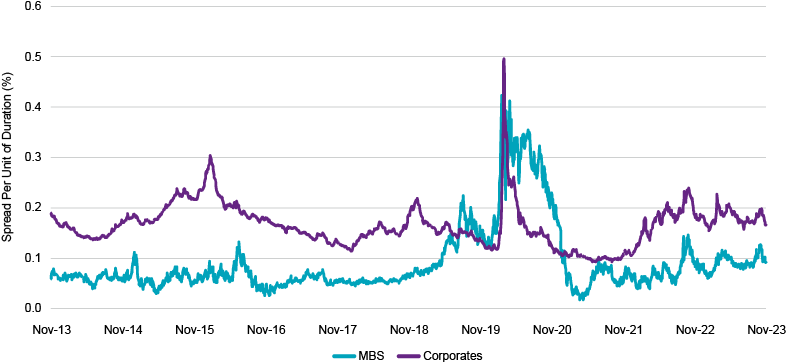
Source: FactSet
But corporates should outyield mortgages, given that they are lower in credit quality with no explicit or implicit government guarantee. So what about other more return-seeking securitized sectors like CMBS (commercial mortgage-backed securities) and ABS (asset-backed securities)? Thanks to shorter loan terms and – in the case of CMBS – prepayment penalties, these two categories don’t fluctuate as much in duration. Both have durations below MBS.
ABS (2.7 years duration) compares similarly to 1-to-5-year corporates (2.6 years duration) – and a spread per unit of duration comparison favors corporates.
Spread Per Unit of Duration: ABS vs. 1–5 Year Corporates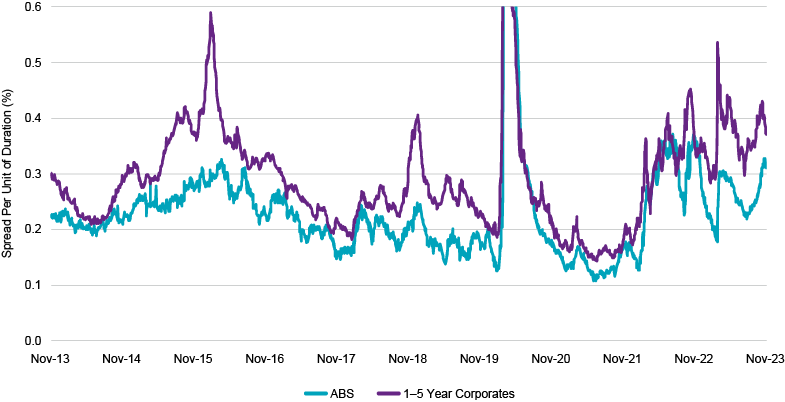
Source: FactSet
Spread Per Unit of Duration: CMBS vs. 1–10 Year Corporates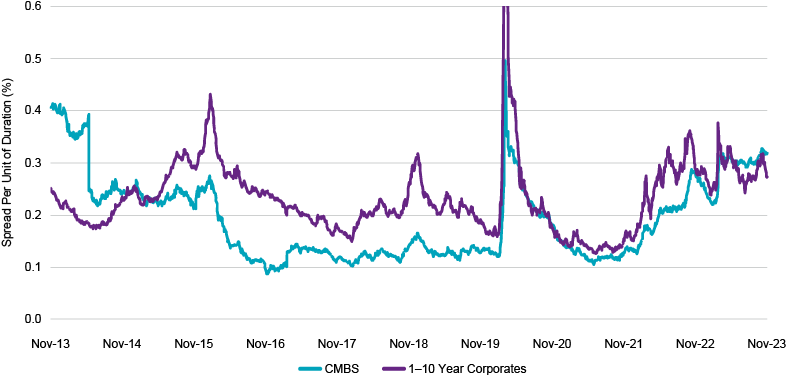
Source: FactSet
But consider the backdrop for commercial mortgages. CMBS spreads are slowly approaching Covid-era levels, a bizarre combination of higher-quality securities trading with flat or even tighter spreads while lower-quality spreads go wider than Covid highs. If that overall spread looks appealing, are you bullish on lower-quality commercial properties? The office sector has gotten smoked over the past two years and – perhaps somewhat of a silver lining – now represents a smaller portion of the asset class than it has over the past several years.
In addition to the lower weight in the index due to price action, we’ve also started to see a structural shift away from office in new issuance. In the prior five years, CMBS deals had more average exposure to office (33%) than any other sector. For 2023 vintages, office exposure has declined to around 21%. So it’s not as bad as it was a couple of years ago. Also, investors in CMBS are getting more diversified exposure to retail, residential, hotel, industrial and data storage properties. But the bottom line is you’re getting paid only a tiny bit more than corporates – and still taking on some pretty meaningful risk for doing so.
Convexity Now Positive for MBS
Another dynamic at play with securitized returns is convexity. MBS is typically a negative convex asset class, which just means that prices rise more slowly as yields fall, due to early prepayment of principal. As prepayment risk has diminished, MBS is actually demonstrating positive convexity, meaning prices rise faster as yields fall. So, when you consider a potential falling rate environment in 2024, one could make the case that MBS will more fully participate in the duration math of lower yields and keep pace with corporate bonds, while staying higher up in quality.
But we don’t think that scenario is as likely for two reasons. First, MBS convexity, while positive, is still lower than Treasuries and corporates. Second, new mortgage origination has been so constrained that you could see a pop in activity even if rates fall just a little. After seeing mortgage rates above 8%, maybe a 6-handle is enough for that first-time homebuyer to pounce. We shouldn’t need mortgage rates back in the 3s to see transactional volume normalize. That pent-up demand could manifest much sooner, flipping convexity back to negative and providing a ceiling on upside return potential.
One slight boost to securitized investors: New MBS issuance is likely to be constrained even further in the short term, as home sales slow throughout the winter months. If yields continue to fall throughout the winter, and economic data holds up, mortgages are likely to slightly outperform Treasuries. Additionally, the various dislocations that exist between securities (e.g. new mortgages vs. old mortgages, high quality vs. low quality CMBS) provide a nice backdrop for active management to outperform passive benchmarks.
Bottom Line: Corporates Remain More Attractive
Investors with too much capital in cash or Treasuries could certainly benefit from an allocation to securitized, in order to participate more broadly in a falling rate environment. But the case for meaningful outperformance – the type of outperformance that would make you regret not loading up on securitized – remains pretty challenging. For diversified investors, yield-seeking investors, return-seeking investors, and investors looking to tactically allocate toward relative value… if you are in any of those categories… we still like corporates.
The views and opinions (as of November 20, 2023) are those of the author(s) and not Natixis Investment Managers or any of its affiliates. This discussion is for educational purposes and should not be considered investment advice.
All investing involves risk, including the risk of loss. Investment risk exists with equity, fixed income, and alternative investments. There is no assurance that any investment will meet its performance objectives or that losses will be avoided. Investors should fully understand the risks associated with any investment prior to investing.
Although Natixis Investment Managers believes the information provided in this material to be reliable, including that from third party sources, it does not guarantee the accuracy, adequacy, or completeness of such information.
This document may contain references to copyrights, indexes and trademarks that may not be registered in all jurisdictions. Third party registrations are the property of their respective owners and are not affiliated with Natixis Investment Managers or any of its related or affiliated companies (collectively “Natixis”). Such third-party owners do not sponsor, endorse or participate in the provision of any Natixis services, funds or other financial products.
Natixis Advisors, LLC provides advisory services through its division Natixis Investment Managers Solutions which is an affiliate of Natixis Investment Managers, LLC.
6119283.1.1


 60/40 Portfolio Simplicity