


Inflation Inaction?
The Natixis 2022 Global Survey of Financial Professionals found that inflation is top of mind for advisors too. They say it’s the biggest risk to the economic outlook for the US and frequently hear from concerned clients, “Does my portfolio have inflation protection?”
The answer: yes, but not much. It turns out advisors and investors haven’t done much to immunize portfolios from the impact of inflation.
Inflation Protection Lags Inflation
In our consulting business, we see hundreds of advisor-built model portfolios annually and have tracked inflation protection over time (Figure 1). Currently, just over 4% of portfolios are allocated to categories traditionally considered inflation beneficiaries (see Figure 2). That compares to an all-time high of 6.2% in Q1 2013 when Core CPI was well behaved at under 2%. The recent increase in exposure has lagged the uptick in CPI by a few quarters, so the trend may still be higher.
Figure 1 - As Inflation has Risen, Allocation to Inflation-Protected Categories in Model Portfolios has Waned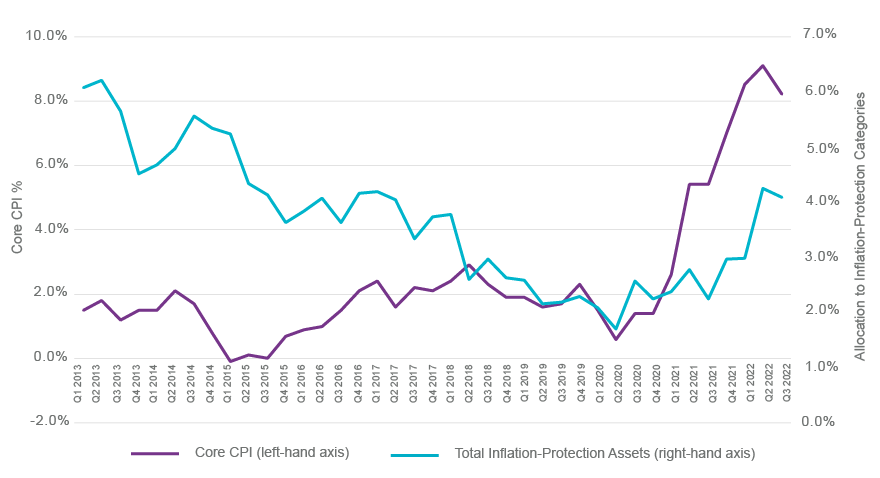
Source: U.S. Bureau of Labor Statistics, Natixis Investment Managers Solutions. The Portfolio Analysis & Consulting Moderate Risk Peer Group is based on 176 moderate portfolios submitted to Portfolio Analysis & Consulting from April 2022 to September 2022. Data as of 9/30/2022.
Figure 2 - Inflation Protection Categories
| US Category Group | Morningstar Category |
| Commodities | Commodities Broad Basket |
| Commodities | Commodities Focused |
| Sector Equity | Energy Limited Partnership |
| Sector Equity | Equity Energy |
| Sector Equity | Equity Precious Metals |
| Sector Equity | Global Real Estate |
| Sector Equity | Infrastructure |
| Sector Equity | Natural Resources |
| Sector Equity | Real Estate |
| Taxable Bond | Inflation-Protected Bond |
Source: Natixis Investment Managers Solutions, Morningstar Direct
Asset Flows to Inflation Protection Categories
Industry wide, mutual funds and ETFs in these inflation protection categories experienced positive net flows for several quarters until flipping negative in Q2 2022 (Figures 3 and 4). Unlike the lag in the Natixis peer group data, the inflows were concurrent with rising inflation and turned negative once Core CPI started to stabilize.
The Inflation-Protected Bond category initially raked in the most assets, likely due to the bonds’ explicit link to CPI. But that’s reversed this year as higher rates have hurt the principal value of these longer duration bonds. Commodities, another favorite in the inflation playbook, saw little interest until Q1 2022 when the Ukraine-Russia war broke out. That’s despite “69% of advisors agree[ing] that rising rates and inflation have made commodities more appealing, their most bullish call2.”
Figure 3 - Quarterly Net Flows & Total Net Assets in Inflation Protection Categories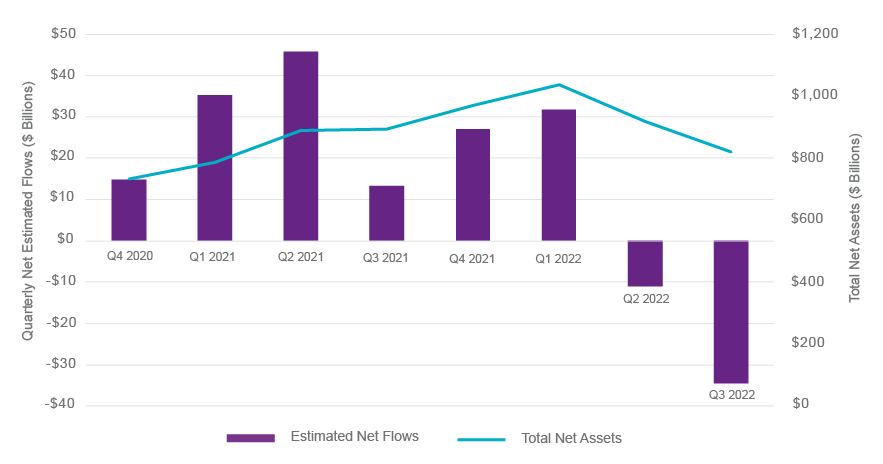
Source: Natixis Investment Managers Solutions, Morningstar Direct
Figure 4 - Inflation Protection Categories' Net Flows by Quarter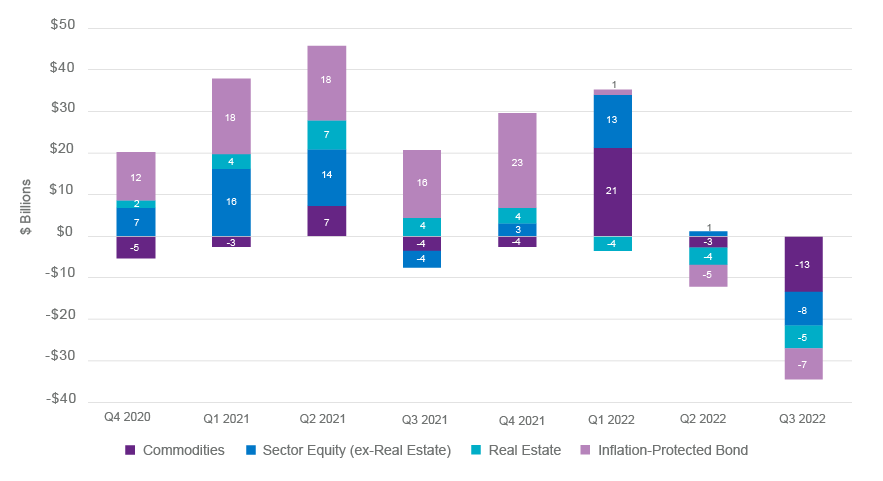
Source: Natixis Investment Managers Solutions, Morningstar Direct
Why the Hesitation?
So why might advisors and investors be hesitant to protect their portfolios from the effects of inflation more aggressively? We can offer several potential explanations:
- Inflation was supposed to be transitory and shorter lived than we’ve experienced. So long-term investors might have just missed the opportunity to hedge or weren’t interested in battling a short-term phenomenon.
- Maybe investors consider 4% inflation protection enough for their portfolios. It’s better than zero and doesn’t require wholesale changes (and potentially realizing taxable gains).
- The inflation we’ve seen has largely been expected by the market. Since hedges are most effective when unexpected inflation pops up, the reward for buying insurance in the middle of the storm shouldn’t pay off as much.
- Investors are more likely to be high-income consumers and, therefore, less affected by inflation. They might be less inclined to add protection if they didn’t feel the same sting as lower-income Americans.
- Commodities, energy, and real estate can be volatile areas of the market. Poor experiences in these asset classes in the past may have led investors to avoid them for behavioral reasons.
- Instead of adding to the inflation protection categories, investors may have simply shortened up bond duration to avoid some of the pain from the Fed’s inflation-motivated rate hikes.
- With so few places to hide this year, sidestepping volatility with cash may have seemed better than trying to beat inflation.
- Over the long term, the argument goes, corporations can pass along higher prices to their customers, so you get a bit of inflation protection for owning stocks outright.
2 https://www.im.natixis.com/us/research/2022-financial-professionals-report
This material is provided for informational purposes only and should not be construed as investment advice. The views and opinions contained herein reflect the subjective judgments and assumptions of the authors only and do not necessarily reflect the views of Natixis Investment Managers, or any of its affiliates. The views and opinions are as of October 11, 2022 and may change based on market and other conditions. There can be no assurance that developments will transpire as forecasted, and actual results may vary.
All investing involves risk, including the risk of loss. Investment risk exists with equity, fixed income, and alternative investments. There is no assurance that any investment will meet its performance objectives or that losses will be avoided. Investors should fully understand the risks associated with any investment prior to investing.
CFA® and Chartered Financial Analyst® are registered trademarks owned by the CFA Institute.
This document may contain references to copyrights, indexes and trademarks that may not be registered in all jurisdictions. Third party registrations are the property of their respective owners and are not affiliated with Natixis Investment Managers or any of its related or affiliated companies (collectively “Natixis”). Such third party owners do not sponsor, endorse or participate in the provision of any Natixis services, funds or other financial products.
5067801.1.1