Markets
 International equities: Finding value in Europe vs. Japan
 Staying invested in equities during market highs
 Stashed in cash? Fed rate cuts favor fixed income
 Investment Outlook: Loomis Sayles
An extended runway for economic growth now that inflation has been tamed and asset classes that may benefit are covered in Loomis Sayles’ outlook.
 How Healthy Is the High Yield Bond Market?
Risk and opportunities in today’s high yield bond market are assessed by Loomis Sayles’ Full Discretion Head Matt Eagan.
 No Cuts? No Problem.
Portfolio manager Jack Janasiewicz and investment strategist Brian Hess discuss inflation, rates, growth, and positioning in the Natixis model portfolios.
US Inflation Tracker highlights key indicators related to personal consumption, supply chain dynamics, housing, wage pressures and inflation expectations.
 All About The Rates
Away-from-zero rates and double-digit volatility have meaningfully enhanced options-based strategies such as those managed by Gateway since 1977.
 Credit Market Outlook: Solid Fundamentals and FOMO
Yield, dispersion, and fear of missing out in investment grade bonds is highlighted by Loomis Sayles’ Brian Kennedy.
 Election 2024: Candidates, Congress, and Weary Constituents
Political pundits discuss the 2024 election, voter fatigue, and critical issues that need to be addressed.
 Macro Outlook: Catalysts, Confidence & Cuts
Macro discussion of topics including US growth and the consumer, international markets, inflation, the Federal Reserve, and equity market themes.
 Quality Comparison: Minimum Volatility and High Dividend
Historical analysis shows how the equity Quality factor has outperformed Minimum Volatility and High Dividend factors since 1995.
 Top 5 Financial Advisor Questions About ETFs
Natixis experts sum up ETF benefits and attributes from best execution, tax efficiency, and liquidity to the creation/redemption process and more.
 Bubble Trouble?
Portfolio manager and strategist Jack Janasiewicz discusses inflation anomalies, February market highs, AI, and comparisons with the dot-com bubble.
 March Madness: Top Picks for Fixed Income Investing
Which fixed income category is poised to outperform in 2024? Analysis is offered in this March madness bond bracketology.
 What’s It Take to Be an AI Winner?
AI will impact every business, but only a few companies will be winners like Nvidia, says Loomis Sayles’ Aziz Hamzaogullari.
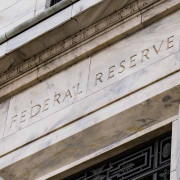 Herding Hawks at the Fed
Portfolio manager and strategist Jack Janasiewicz discusses inflation nuances and the Federal Reserve’s need for “greater confidence” before cutting rates.
 Plan Ahead for Tighter Spreads
As the yield difference across fixed income securities narrows, actively managed bond funds may offer advantages for bearish – and bullish – investors.
 What’s Behind the Value Advantage of International Stocks?
International stocks may have a value advantage despite higher earnings growth in the US, explains Harris Associates’ David Herro.
 Fixed Income Dashboard
The quarterly Fixed Income Dashboard provides key relative data points ranging from credit conditions and inflation trends to asset flows and yields.
 Can You Bank on US Financial Stocks for Value?
Value investing expert Bill Nygren, CIO-US, Harris Associates, breaks down why US bank stocks look attractive today.
 Economic and Financial Outlook 2024
When will central banks begin to cut rates in 2024? Will liquidity conditions improve or worsen? Should investors look to take on more risk now, or wait until after decisive elections have played out across several key economies?
 Sustainable Investing: Transformational trends to watch
Compelling AI applications, renewable energy recovery, and pharma developments are considered for 2024 by Jens Peers.
 What Really Matters in 2024
Portfolio manager and strategist Jack Janasiewicz explains why growth, labor trends and risk appetite are what matters most to the markets this year.
 Backdrop for Bond Investing Brighter in 2024
Fed rate cuts and softer inflation should drive more opportunities for bond investors, says Loomis Sayles’ Peter Palfrey.
 Portfolio Manager Insights: Themes & Risks for 2024
From a recession to AI, portfolio managers share diverse views on the big topics shaping investment decisions in 2024.
 Managing Equity Market Volatility in 2024
Catalysts for market volatility and ways to help manage it in portfolios are covered by an options expert at Gateway.
 Going Where the Value Is Greater: International Equities
Catalysts for value investing are explored by David Herro, CIO-International Equities at Harris Associates/Oakmark Funds.
 Could Small Cap Stocks Be a Sweet Spot in 2024?
Why the small cap stock universe is an appealing place for Vaughan Nelson’s Chris Wallis to be investing in is explored.
 Macro Outlook: Turn the Page
Portfolio strategists offer their take on the Treasury market, interest rates, labor markets, consumption trends and attractive market sectors.
 Rate Cuts on the Horizon?
The latest economic data prints are paving the way for interest rate cuts in 2024 according to portfolio manager and strategist Jack Janasiewicz.
 Observations & Ideas for a Higher Yield World
Higher capture of yield and market fundamentals should be good for bond investors in 2024, explains Loomis Sayles’ Matt Eagan.
 Growth Trends with a Long Runway
Secular growth trends, AI disruptions, and investing during tense geopolitical times are explained by Aziz Hamzaogullari.
 Straight Talk on the Treasury Market
Who’s buying? Who’s selling? What about the deficit? Portfolio Manager Jack Janasiewicz discusses the dynamics and mechanics roiling the US Treasury market.
 Value Investing Amid a Turbulent Fixed Income Climate
View fixed income through a value investing lens and overlook short-term concerns to uncover opportunity.
 Value Gap in US Equities Is Widening Again
A number of low price-to-earnings stocks are making it an attractive environment for US stock pickers, explains Bill Nygren, CIO-US at Harris Associates.
 Triple Discount in International Equities
Significant value in international equity markets and why higher for longer interest rates should benefit European financials is explained by David Herro.
 Cruel September
Portfolio Manager Jack Janasiewicz examines seasonality patterns and the rise in bond yields, oil, and the dollar that weighed on risk assets in September.
 Corporate Bond Shortage on the Horizon?
Higher interest rates have changed supply, demand and spread dynamics for investment grade corporate bonds, particularly for longer duration issues.
 A Look Behind the Curtain – ETF Primary Markets
The behind-the-scenes workings of the primary market explain some unique advantages that ETFs can provide for investors.
 What’s Next for Europe’s Natural Gas Dilemma and Economy?
Europe’s avoidance of an energy crisis in 2022, natural gas supply/demand, attractive valuations, and the investment opportunity in the region are analyzed.
 Value Investing in an Evolving World
Wide price differentials in US equity markets today and lack of diversification in index funds favor value investors like Oakmark, explains Bill Nygren.
 Revalidating the Case for Duration in Fixed Income Portfolios
Three scenarios for where the yield curve may be at year-end 2024 and the advantages of adding duration to fixed income portfolios today is analyzed.
 Longer Duration Driving Opportunity in Muni Bonds
Loomis Sayles’ Dawn Mangerson explains significant Fed action, reduced supply, and strong demand leading to the first-ever municipal yield curve inversion.
 Time to Extend Duration with High-Quality Fixed Income
Advantages of adding duration to fixed income portfolios in today’s interest rate environment are explained by Loomis Sayles’ Core Plus Bond Co-Manager.
 3 Tips for Trading ETFs
Trading ETFs can be different from buying and selling individual securities – here are three important tips to consider for ETF trading.
 Returns on Cash May Be Lower Than You Think
While many investors are satisfied with current returns on money market funds and other short-term investments, this may not be the best strategy right now.
 Fixed Income Outlook: More Yield to Be Had?
An interest rate reset, disciplined companies with low potential losses, duration views, opportunities, and risks are shared by our fixed income managers.
 Outlook & Opportunities: Global Equities
Diverse views on growth trends beyond AI, a recession, China, and where the value may be across global markets are offered by our equity managers.
 Outlook: ETF Trends to Watch for in the Second Half of 2023
Bonds vs. equities, active vs. passive, and options-related ETF activity… what ETF investment activity we expect to see for the rest of 2023.
 Identifying Value in the Crossover Corporate Bonds Space
Focusing on the area between investment grade and high yield corporate bonds can be advantageous, explains Loomis Sayles’ Fixed Income Manager Matt Eagan.
 Fixed Income Framework: Cyclicality vs. Inflation
Framework shows how investors can adjust their bond holdings to align with their outlook for inflation, growth and recession scenarios.
 Fixed Income Pulse: What You Need to Know
Yield, duration, and diversification insight are shared by fixed income experts. Advisors’ sentiment from a recent pulse survey is also highlighted.
 Is Inflation Poised to Roll Over?
Analysis of key inflation components including transportation, housing and health insurance shows areas where prices may be heading lower in the year ahead.
 How to Evaluate ETFs
From a pure passive to fully active approach, investors may evaluate their ETF choices on various factors. Our ETF experts offer a quick primer.
 Is the Market Looking Past Lowered Earnings Estimates?
While they aren’t yet reflected in the broad Index, S&P 500® earnings expectations have been revised much lower since mid-year.
 Economic Well-Being of US Consumers in Decline?
While the market narrative points to excess consumer savings, survey data indicate a decline in US consumers’ economic well-being over the past year.
 Positioning Portfolios for Fading Inflation
As year-over-year inflation shows signs of peaking, investors may want to revisit portfolio allocations.
 Why Active ETFs Matter During Volatile Times
NYSE’s ETF Leaders series profiles Vaughan Nelson’s Dan Hughes on how a truly active approach aims to help clients navigate today’s challenging markets.
 Bank Loan Basics: An Income Diversifier for All Times
An introduction to bank loans and their benefits: seniority, security, floating interest rates, and diversification for the short or long term.
 Welcome to the Meh Market
After a first half run-up, our market strategists think rate cuts are already priced in, leaving little to get excited about in the second half of 2019.
1615540.4.1


