


Economic and Financial Outlook 2024

|
|---|

|

|
|---|

|
After all, 2024 is an election year – and not just in the US, the world’s largest economy. Russia, India and the UK are all expected to hold decisive elections in 2024, and situations can develop swiftly and substantially at the policymaker level.
Whether you are bullish or bearish for the year ahead, read on to hear what strategists from the Natixis Investment Managers Solutions team think about markets, trends, and asset classes. Their perspectives, from either side of the Atlantic, provide some much needed clarity to the overall picture of growth and central bank rate setting across multiple markets.
Garrett Melson,
Portfolio Strategist,
Natixis Investment Managers Solutions – US
2023 was a year defined by sharp and swift narrative shifts as the market grappled with duelling prospects surrounding the economic outcomes with respect to growth, inflation, and ultimately, Fed policy. Hard landing expectations gave way to soft landing hopes, which gave way to no landing fears back to hard landing doom. And around and around we went.
While consensus has once again embraced the soft-landing narrative, to many the jury is still out on whether a soft landing has been achieved. That debate may still be raging, but in many ways the soft landing is already upon us, and from our perch, the outlook for 2024 remains brighter than consensus appreciates. We’ve long been in the soft-landing camp as we believed resilient growth would not prove incompatible with disinflationary forces taking hold as the economy finally normalized from the series of negative supply and positive demand shocks unleashed by the pandemic and capped off with the off with the war in Ukraine.
As we flip the calendar into 2024, many of the distortions from the past few years are finally fading, helping nominal growth to slowly slow as inflation moderates back to 2% despite resilient real growth. And while consensus estimates place US real GDP growth at a meagre 1.3% for 2024, we see a strong case for firmer upside.
First, fiscal drag, which was a meaningful headwind to growth in 2022, has faded consistently through 2023 and is set to become modestly supportive as we move through 2024. Bloated inventories have been largely right sized and with consumption holding up, a restocking cycle looks to be underway which should support industrial production, particularly within defence and the auto and aircraft sectors.
Manufacturing construction activity continues to grow at a robust pace, supported by legislative incentives and supply chain reconfiguration. On a related note, the broader capex cycle looks to remain supportive as capex spending begets further capex spending and companies look to invest further for efficiency gains in the wake of the 2021-2022 experience.
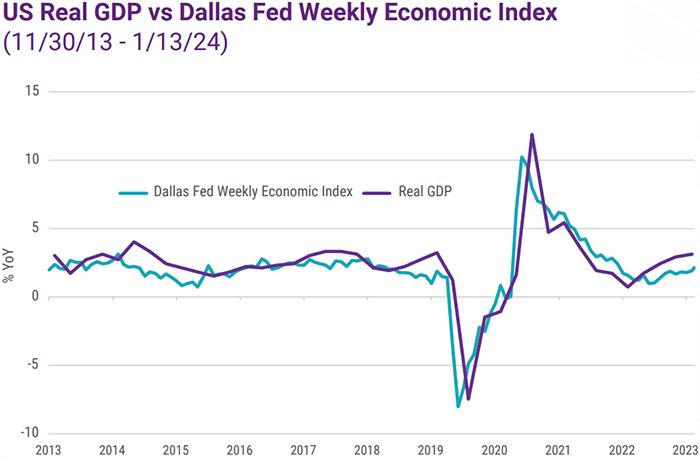
Source: Bloomberg
While federal spending is set to moderate, state and local governments remain flush with cash and should continue to provide a meaningful fiscal impulse. Consumption looks to remain strong as consumer balance sheets remain robust, the labour market remains strong, and real wages are rising as inflation continues to fade.
And finally, the housing market looks set to kick back into gear in 2024 as falling interest rates and compressing rate volatility drive mortgage rates lower helping to revitalize residential construction and housing adjacent goods and services. A litany of catalysts that argue for a more constructive outlook on US economic activity.
A common refrain we continue to hear from the marketplace is that the last mile of disinflation will be the hardest, a task likely to prove even more challenging should growth remain resilient. Yet, as we already stated, a soft landing has already arrived. Despite the reacceleration in growth in 2023, labour markets have come back into balance, income growth is consistent with 2% inflation, and core Personal Consumption Expenditures (PCE) is now annualizing at just 1.9% over the past 6 months.
Inflation is tracking below target while growth is running close to trend. And with a pipeline of housing disinflation set to manifest in the quarters ahead, annual inflation rates will continue to settle towards the Fed’s 2% target, potentially as early as the second quarter of 2024.
Labour markets are no longer a threat to price stability, disinflationary real growth continues as supply chain frictions fade and productivity picks up, and nominal growth continues to slowly slow as inflation cools.
The soft landing has arrived, and that means surgical rate cuts are incoming as policy is recalibrated back from restrictive to neutral. And while debate continues as to the timing and magnitude of those cuts, that matters only at the margin. As long as growth is not falling precipitously, the bias for risk assets will be higher.
Portfolio Strategist,
Natixis Investment Managers Solutions – US
2023 was a year defined by sharp and swift narrative shifts as the market grappled with duelling prospects surrounding the economic outcomes with respect to growth, inflation, and ultimately, Fed policy. Hard landing expectations gave way to soft landing hopes, which gave way to no landing fears back to hard landing doom. And around and around we went.
While consensus has once again embraced the soft-landing narrative, to many the jury is still out on whether a soft landing has been achieved. That debate may still be raging, but in many ways the soft landing is already upon us, and from our perch, the outlook for 2024 remains brighter than consensus appreciates. We’ve long been in the soft-landing camp as we believed resilient growth would not prove incompatible with disinflationary forces taking hold as the economy finally normalized from the series of negative supply and positive demand shocks unleashed by the pandemic and capped off with the off with the war in Ukraine.
As we flip the calendar into 2024, many of the distortions from the past few years are finally fading, helping nominal growth to slowly slow as inflation moderates back to 2% despite resilient real growth. And while consensus estimates place US real GDP growth at a meagre 1.3% for 2024, we see a strong case for firmer upside.
First, fiscal drag, which was a meaningful headwind to growth in 2022, has faded consistently through 2023 and is set to become modestly supportive as we move through 2024. Bloated inventories have been largely right sized and with consumption holding up, a restocking cycle looks to be underway which should support industrial production, particularly within defence and the auto and aircraft sectors.
Manufacturing construction activity continues to grow at a robust pace, supported by legislative incentives and supply chain reconfiguration. On a related note, the broader capex cycle looks to remain supportive as capex spending begets further capex spending and companies look to invest further for efficiency gains in the wake of the 2021-2022 experience.
Source: Bloomberg
While federal spending is set to moderate, state and local governments remain flush with cash and should continue to provide a meaningful fiscal impulse. Consumption looks to remain strong as consumer balance sheets remain robust, the labour market remains strong, and real wages are rising as inflation continues to fade.
And finally, the housing market looks set to kick back into gear in 2024 as falling interest rates and compressing rate volatility drive mortgage rates lower helping to revitalize residential construction and housing adjacent goods and services. A litany of catalysts that argue for a more constructive outlook on US economic activity.
A common refrain we continue to hear from the marketplace is that the last mile of disinflation will be the hardest, a task likely to prove even more challenging should growth remain resilient. Yet, as we already stated, a soft landing has already arrived. Despite the reacceleration in growth in 2023, labour markets have come back into balance, income growth is consistent with 2% inflation, and core Personal Consumption Expenditures (PCE) is now annualizing at just 1.9% over the past 6 months.
Inflation is tracking below target while growth is running close to trend. And with a pipeline of housing disinflation set to manifest in the quarters ahead, annual inflation rates will continue to settle towards the Fed’s 2% target, potentially as early as the second quarter of 2024.
Labour markets are no longer a threat to price stability, disinflationary real growth continues as supply chain frictions fade and productivity picks up, and nominal growth continues to slowly slow as inflation cools.
The soft landing has arrived, and that means surgical rate cuts are incoming as policy is recalibrated back from restrictive to neutral. And while debate continues as to the timing and magnitude of those cuts, that matters only at the margin. As long as growth is not falling precipitously, the bias for risk assets will be higher.
Mabrouk Chetouane,
Head of Global Market Strategy,
Natixis Investment Managers Solutions – International
The eurozone faces a challenging economic landscape in 2024, especially when compared to that of the US. The significant deceleration in growth from 3.4% in 2022 to just 0.6% in 2023 is attributed to a series of shocks impacting major eurozone countries.
These shocks underscore the fragility and increasing heterogeneity within the eurozone, posing a key weakness for the European region. Disruptions in supply chains, escalating input costs, labour market pressures due to generalized scarcity, and divergent industrial and energy strategies have not only resulted in varying growth rates across the eurozone but have also exposed the region to persistent inflationary risks. For instance, while Spain experienced a 2.3% growth in GDP in 2023, Germany faced stagnation or a slight contraction amid ongoing nominal tensions.
Despite this challenging backdrop, there's a glimmer of hope for 2024. Modest growth of around 1% is anticipated – although this projection raises key questions: Could the shocks that have hit many European countries resurface in 2024? Is inflation a lingering concern? Is the growth rate achievable?
The eurozone has weathered three significant shocks:
Positive factors include the continuation of accommodating fiscal policies supporting certain segments of the economy. Although debt ratios may slightly normalize, the targets set out in the Maastricht Treaty may not be fully met. Despite challenges from the Karlsruhe Court, Germany might resort to its budgetary tools given its disappointing growth performance in 2023.
However, the real driver of growth in the eurozone is expected to be private consumption, buoyed by favourable labour market conditions. Despite lacklustre growth in 2023, employment in the eurozone saw a significant rise (+1.3% YoY– see chart).
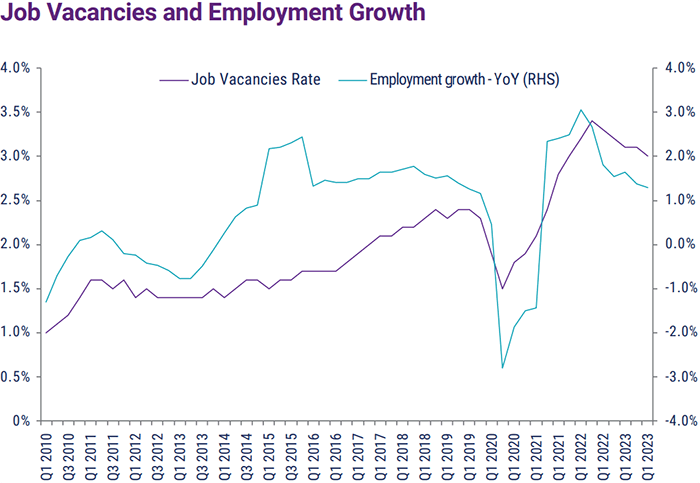
Source: Bloomberg
Some might think that this increase in employment would come to an end in 2024, but the number of job vacancies remains high. Surveys by the European Commission reveal that employment remains a top concern for companies looking to boost production levels across the region. This tension in the labour market is likely to support wage growth, exceeding inflation levels. In essence, real wage growth in the eurozone is projected to surpass 2023 levels, providing crucial support to the primary driver of economic activity, namely European household consumption.
A return to potential growth should therefore be possible in 2024, primarily driven by domestic demand components. Nevertheless, this projection poses two fundamental questions:
Head of Global Market Strategy,
Natixis Investment Managers Solutions – International
The eurozone faces a challenging economic landscape in 2024, especially when compared to that of the US. The significant deceleration in growth from 3.4% in 2022 to just 0.6% in 2023 is attributed to a series of shocks impacting major eurozone countries.
These shocks underscore the fragility and increasing heterogeneity within the eurozone, posing a key weakness for the European region. Disruptions in supply chains, escalating input costs, labour market pressures due to generalized scarcity, and divergent industrial and energy strategies have not only resulted in varying growth rates across the eurozone but have also exposed the region to persistent inflationary risks. For instance, while Spain experienced a 2.3% growth in GDP in 2023, Germany faced stagnation or a slight contraction amid ongoing nominal tensions.
Despite this challenging backdrop, there's a glimmer of hope for 2024. Modest growth of around 1% is anticipated – although this projection raises key questions: Could the shocks that have hit many European countries resurface in 2024? Is inflation a lingering concern? Is the growth rate achievable?
The eurozone has weathered three significant shocks:
- First, the energy crisis that was triggered by a series of external and internal shocks and remains only partially resolved. The end of the era of cheap gas only possible thanks to Russian supplies, has disrupted the market balance. The resulting higher gas prices, which remains higher than prior to the invasion of Ukraine, have prompted a reassessment of industrial and energy policies in Germany.
- Added to this is China's slowing growth, which is no longer able to take advantage of world trade that is no longer growing (volumes flat since 2022) and which has plunged the German and Italian manufacturing sectors into turmoil. China is likely to continue to suffer from its property crisis, which will continue to undermine confidence and household consumption. We expect Chinese growth to remain in a range between 4.4% and 4.7% in 2024.
- Finally, the tightening of monetary and financial conditions completes the picture. The sharp and unprecedented rise in European interest rates has had a severe impact on lending to households and businesses, particularly those without access to corporate debt markets. This is reflected in the near stagnation of productive investment and the fall in gross fixed capital formation in the residential sector.
Positive factors include the continuation of accommodating fiscal policies supporting certain segments of the economy. Although debt ratios may slightly normalize, the targets set out in the Maastricht Treaty may not be fully met. Despite challenges from the Karlsruhe Court, Germany might resort to its budgetary tools given its disappointing growth performance in 2023.
However, the real driver of growth in the eurozone is expected to be private consumption, buoyed by favourable labour market conditions. Despite lacklustre growth in 2023, employment in the eurozone saw a significant rise (+1.3% YoY– see chart).
Source: Bloomberg
Some might think that this increase in employment would come to an end in 2024, but the number of job vacancies remains high. Surveys by the European Commission reveal that employment remains a top concern for companies looking to boost production levels across the region. This tension in the labour market is likely to support wage growth, exceeding inflation levels. In essence, real wage growth in the eurozone is projected to surpass 2023 levels, providing crucial support to the primary driver of economic activity, namely European household consumption.
A return to potential growth should therefore be possible in 2024, primarily driven by domestic demand components. Nevertheless, this projection poses two fundamental questions:
- Does a resurgence in growth through demand pose a challenge to the ongoing disinflationary trends in the eurozone?
- How will the European Central Bank (ECB) respond to the backdrop of persistent inflation and a concurrent rise in economic growth?
Jack Janasiewicz,
Lead Portfolio Strategist,
Natixis Investment Managers Solutions – US
2023 saw unprecedented moves in bond yields, pushing both realized and implied volatility to levels not witnessed since the Global Financial Crisis. A combination of fundamental and technical factors are to blame but the worst is likely behind us. And this is a good thing for risk appetite.
On the fundamental side, the combination of the significant monetary policy response from global central banks and the resulting uncertainty surrounding the path of future inflation and growth left investors contemplating a wide range of possible outcomes that included significant distribution tails – something that the markets had a difficult time digesting. Until investors were comfortable with the trajectory of inflation, the Fed’s terminal rate and the associated economic fallout, it was difficult to see any long last equilibrium level for interest rates. Simply put: the data needed to play out and supply chains needed time to heal.
Complicating matters, the technical side of the equation began to amplify Treasury market volatility. The Treasury market had been undergoing a structural shift in its buyer base since the start of the pandemic. Price insensitive buyers, namely central banks, had largely dominated the markets through quantitative easing during COVID. But as balance sheet unwind began in earnest, these buyers were no longer the dominant player. Households, price sensitive buyers, were finding value in government bonds given the higher yields and were now the incremental bid in the Treasury markets.
Bond investors certainly took their lumps in 2022 and much of 2023 as fixed income delivered negative total returns. Price sensitive investors slowly moved to the side-lines, still feeling the scars from stepping in front of the duration buzz that destroyed many P&Ls during the previous quarters. This void in demand created a buyers strike which left the bond market in the hands of leveraged players and trend followers. And with the trend being higher for yields, the momentum only accelerated, creating even more volatility in the fixed income markets as yields pushed to levels not seen in almost two decades.
Fast forward to today and many of those fundamental and technical considerations that pushed volatility higher have found greater clarity. Inflation concerns continue to melt away by the day as core PCE inflation continues to march towards the 2% target. The US Federal Reserve now looks set to be pivoting away from higher for longer, instead moving towards surgical cuts expected by mid-2024. The soft-landing narrative has come full circle and is now the seemingly consensus outlook. And price sensitive buyers appear to have found value in the bond market against this increased clarity.
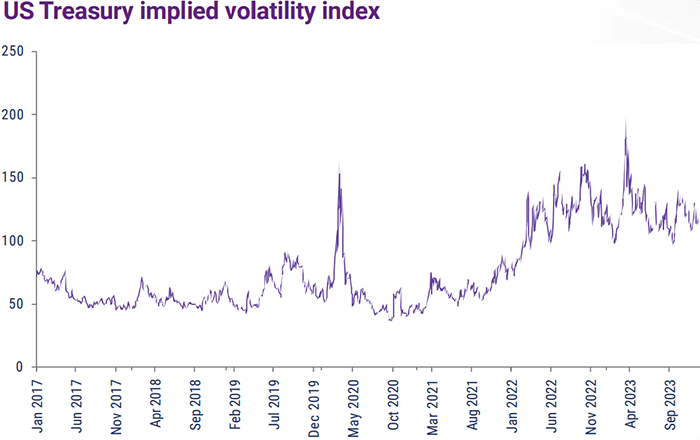
Source: Bloomberg
All of those uncertainties that plagued much of the last three years have now faded and the market seems to be much more comfortable with the potential range of outcomes. No longer is the distribution curve fat and flat. Rather, it is much more normally shaped, with shorter tails and a less variability around the mean. The result? Bond market volatility should continue to ease and move back towards more normal levels. And as bond market volatility drops, so should risk aversion.
Lead Portfolio Strategist,
Natixis Investment Managers Solutions – US
2023 saw unprecedented moves in bond yields, pushing both realized and implied volatility to levels not witnessed since the Global Financial Crisis. A combination of fundamental and technical factors are to blame but the worst is likely behind us. And this is a good thing for risk appetite.
On the fundamental side, the combination of the significant monetary policy response from global central banks and the resulting uncertainty surrounding the path of future inflation and growth left investors contemplating a wide range of possible outcomes that included significant distribution tails – something that the markets had a difficult time digesting. Until investors were comfortable with the trajectory of inflation, the Fed’s terminal rate and the associated economic fallout, it was difficult to see any long last equilibrium level for interest rates. Simply put: the data needed to play out and supply chains needed time to heal.
Complicating matters, the technical side of the equation began to amplify Treasury market volatility. The Treasury market had been undergoing a structural shift in its buyer base since the start of the pandemic. Price insensitive buyers, namely central banks, had largely dominated the markets through quantitative easing during COVID. But as balance sheet unwind began in earnest, these buyers were no longer the dominant player. Households, price sensitive buyers, were finding value in government bonds given the higher yields and were now the incremental bid in the Treasury markets.
Bond investors certainly took their lumps in 2022 and much of 2023 as fixed income delivered negative total returns. Price sensitive investors slowly moved to the side-lines, still feeling the scars from stepping in front of the duration buzz that destroyed many P&Ls during the previous quarters. This void in demand created a buyers strike which left the bond market in the hands of leveraged players and trend followers. And with the trend being higher for yields, the momentum only accelerated, creating even more volatility in the fixed income markets as yields pushed to levels not seen in almost two decades.
Fast forward to today and many of those fundamental and technical considerations that pushed volatility higher have found greater clarity. Inflation concerns continue to melt away by the day as core PCE inflation continues to march towards the 2% target. The US Federal Reserve now looks set to be pivoting away from higher for longer, instead moving towards surgical cuts expected by mid-2024. The soft-landing narrative has come full circle and is now the seemingly consensus outlook. And price sensitive buyers appear to have found value in the bond market against this increased clarity.
Source: Bloomberg
All of those uncertainties that plagued much of the last three years have now faded and the market seems to be much more comfortable with the potential range of outcomes. No longer is the distribution curve fat and flat. Rather, it is much more normally shaped, with shorter tails and a less variability around the mean. The result? Bond market volatility should continue to ease and move back towards more normal levels. And as bond market volatility drops, so should risk aversion.
Jack Janasiewicz,
Lead Portfolio Strategist,
Natixis Investment Managers Solutions – US
US debt sustainability continues to be the bogeyman of the US bond market. Here we address five key points that bond investors should contemplate before hanging their hat on this proverbial risk.
1. Net Worth
Let’s treat the US government as if it was a company. Look at various assets like oil and natural gas stocks, land, nondefense structures and equipment, military assets and financial assets including gold. The aggregate value of these can be valued at something close to $100 trillion dollars using back of the envelope calculations. In terms of net worth, it’s hard to argue that the US is not credit worthy. It has plenty of assets that may be liquidated to raise funds to service its debt. In addition, household wealth now stands at an estimated $142 trillion dollars – a huge resource that helps to fund government debt and deficits. And let’s not forget the last resort option – printing dollars. In the worst-case scenario, the US could simply print dollars and use those greenbacks to service the debt.
2. The US Dollar
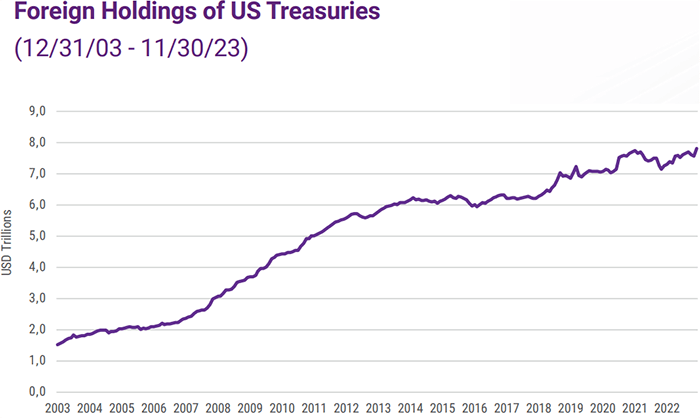
The US financial position will continue to remain supported by strong demand for US debt and dollar denominated assets from both foreign and domestic investors. The US dollar remains the most actively traded currency in the world with global transactions predominantly done in US dollars with no other currency even coming in a close second. We’ve heard the case for the replacement of the US dollar as the world’s reserve currency for years now and if anything the US dollar’s share of global transactions has only increased. And because of this usage, US denominated debt remains in high demand given that the US fixed income market is the deepest and most liquid fixed income market in the world. There are very few fixed income markets that offer this benefit and it remains highly unlikely that this market will be overtaken any time soon.
3. Supply
Supply matters at the margin but it is not a long-term driver of the direction of yields. Rather it’s fundamentals – and more specifically, growth and inflation expectations. Since peaking at over 5% intraday back on October 19th, the benchmark 10-year treasury yield has rallied some 120bps as of year-end. Did the outlook for supply or the fiscal deficit prospects change during that time span? Nope. Rather, the inflation backdrop has shown steady improvement which has been subsequently confirmed by the US Federal Reserve.
Source: Bloomberg
4. Demand
Demand for safe haven assets remains robust given various needs: asset liability matching, reserve managers and their need for liquidity, capital requirements and collateral. In order to get any form of credit these days, borrowers need to post some form of collateral. And the most widely accepted and used form of collateral is US Treasury bills. The lending system operates in a collateral based world and the demand for collateral remains strong, keeping an underlying bid for US T-Bills.
5. Willingness to pay
Unfortunately, opposing political parties will weaponize debt negotiations to influence government spending in their favour. But the US government’s institutional capacity remains strong and intact, and this leaves the risk of default small. The strength of the US as a global economic power augments its credibility and underwrites its promise to pay its debt and this provides greater flexibility for meeting its obligations and widens the scope for taking on addition debt. And because of this, US assets will continue to be desirable and investable despite its debt challenges. Yes, the US national debt is at historical levels. Yes, there are reasonable grounds to have concerns – like what’s the economic return on borrowing or the goals it advances. But the threat of US debt sustainability is not acute and nor is it immediate. It makes for great clicks and headlines. But that’s about it. One needs to look at the fundamentals through a non-political lens.
Lead Portfolio Strategist,
Natixis Investment Managers Solutions – US
US debt sustainability continues to be the bogeyman of the US bond market. Here we address five key points that bond investors should contemplate before hanging their hat on this proverbial risk.
1. Net Worth
Let’s treat the US government as if it was a company. Look at various assets like oil and natural gas stocks, land, nondefense structures and equipment, military assets and financial assets including gold. The aggregate value of these can be valued at something close to $100 trillion dollars using back of the envelope calculations. In terms of net worth, it’s hard to argue that the US is not credit worthy. It has plenty of assets that may be liquidated to raise funds to service its debt. In addition, household wealth now stands at an estimated $142 trillion dollars – a huge resource that helps to fund government debt and deficits. And let’s not forget the last resort option – printing dollars. In the worst-case scenario, the US could simply print dollars and use those greenbacks to service the debt.
2. The US Dollar
The US financial position will continue to remain supported by strong demand for US debt and dollar denominated assets from both foreign and domestic investors. The US dollar remains the most actively traded currency in the world with global transactions predominantly done in US dollars with no other currency even coming in a close second. We’ve heard the case for the replacement of the US dollar as the world’s reserve currency for years now and if anything the US dollar’s share of global transactions has only increased. And because of this usage, US denominated debt remains in high demand given that the US fixed income market is the deepest and most liquid fixed income market in the world. There are very few fixed income markets that offer this benefit and it remains highly unlikely that this market will be overtaken any time soon.
3. Supply
Supply matters at the margin but it is not a long-term driver of the direction of yields. Rather it’s fundamentals – and more specifically, growth and inflation expectations. Since peaking at over 5% intraday back on October 19th, the benchmark 10-year treasury yield has rallied some 120bps as of year-end. Did the outlook for supply or the fiscal deficit prospects change during that time span? Nope. Rather, the inflation backdrop has shown steady improvement which has been subsequently confirmed by the US Federal Reserve.
Source: Bloomberg
4. Demand
Demand for safe haven assets remains robust given various needs: asset liability matching, reserve managers and their need for liquidity, capital requirements and collateral. In order to get any form of credit these days, borrowers need to post some form of collateral. And the most widely accepted and used form of collateral is US Treasury bills. The lending system operates in a collateral based world and the demand for collateral remains strong, keeping an underlying bid for US T-Bills.
5. Willingness to pay
Unfortunately, opposing political parties will weaponize debt negotiations to influence government spending in their favour. But the US government’s institutional capacity remains strong and intact, and this leaves the risk of default small. The strength of the US as a global economic power augments its credibility and underwrites its promise to pay its debt and this provides greater flexibility for meeting its obligations and widens the scope for taking on addition debt. And because of this, US assets will continue to be desirable and investable despite its debt challenges. Yes, the US national debt is at historical levels. Yes, there are reasonable grounds to have concerns – like what’s the economic return on borrowing or the goals it advances. But the threat of US debt sustainability is not acute and nor is it immediate. It makes for great clicks and headlines. But that’s about it. One needs to look at the fundamentals through a non-political lens.
Nicolas Malagardis,
Global Macro & Market Strategist,
Natixis Investment Managers Solutions – International
Investors have been surprised by the performance of the global equity market in 2023, especially European equities. A notable +20% total return in the STOXX 600 and +16% in the EUROSTOXX 50 stand out. However, the small and mid-cap segment, recovering from a sharp fall in 2022 (-16% total return), saw a more modest +13% rise.
The European market continues to live in the shadow of its American counterpart, which keeps benefiting from the remarkable ascent of major technological stocks. Focusing on Europe raises two questions: which parts of the European market show the most potential, and can small caps outperform large caps in 2024?
It's worth noting that the significant upticks in share prices in 2023, whether in large or small capitalization indices, occurred at two specific times – at the start of the year and yearend (see chart).
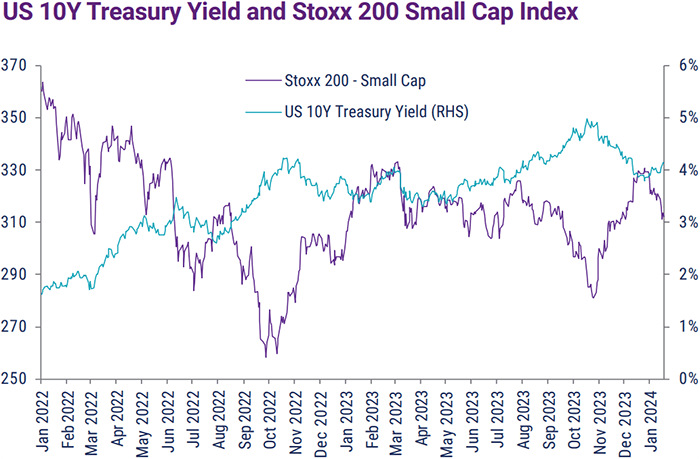
Source: Bloomberg
Past performance is no guarantee of future results.
In both instances, a crucial factor was a substantial easing in long-term interest rates. The sluggish growth in Europe, coupled with expectations of near-zero earnings growth, couldn't solely account for such a surge in stock market indices.
A closer look reveals that the valuation effect, driven by falling interest rates, is the primary factor behind the remarkable rise in share prices in the eurozone. This effect is even more evident in the small-cap universe (+17% between November and December). However, prices in European small cap still stand 13% below those of January 2022 (see chart), whereas large caps stand just 2.3% off their level pre-Ukraine’s invasion.
What can be anticipated for 2024? Will the factors weighing on eurozone small caps for the past three years dissipate?
Eurozone economic growth is expected to rise, propelled by an increase in real wage growth and by a stabilization in Germany’s manufacturing sector. This improvement, spurred by internal factors, is likely to favour the small-cap segment, given its sensitivity to cyclical factors and greater exposure to domestic demand. Expected earnings growth for small caps in 2024 stands at around 14.5%, compared to the consensus forecast of 5.7% for the broader European index.
Moreover, a comparison of valuation multiples at the time of writing reveals a comparable price/earnings ratio, around 12 times expected earnings over the next 12 months, for both market segments. The absence of a valuation gap, unseen since the Great Depression, suggests that small-cap equities have more upside potential, contingent on a smooth realization of our macroeconomic scenario. The indication that the ECB is about to ease should be seen as a signal for those investors waiting to increase their exposure to this asset class.
However, caution is warranted. The ECB lacks sufficient evidence to consider an immediate cut in its key interest rates, with the persistence of core inflation and the expected cyclical improvement acting against such a move. Any change in the ECB's stance may not occur until the beginning of the second quarter, with a potential rate cut likely in the beginning of the third quarter. Exaggerated market reactions to monetary policy will continue to fuel volatility in bond markets and, notably, in the more volatile segments of equity markets like small caps.
Considering the factors outlined above, the small-cap market emerges as the most buoyant among European markets, with exposure to growth drivers, relative valuation, earnings growth in the European cycle, and a gradually less restrictive monetary environment. It's crucial to acknowledge that this assessment is contingent on decisions and communications from the ECB and the Fed, providing the green light for a return to this segment that appears to have emerged from a period of stagnation.
Global Macro & Market Strategist,
Natixis Investment Managers Solutions – International
Investors have been surprised by the performance of the global equity market in 2023, especially European equities. A notable +20% total return in the STOXX 600 and +16% in the EUROSTOXX 50 stand out. However, the small and mid-cap segment, recovering from a sharp fall in 2022 (-16% total return), saw a more modest +13% rise.
The European market continues to live in the shadow of its American counterpart, which keeps benefiting from the remarkable ascent of major technological stocks. Focusing on Europe raises two questions: which parts of the European market show the most potential, and can small caps outperform large caps in 2024?
It's worth noting that the significant upticks in share prices in 2023, whether in large or small capitalization indices, occurred at two specific times – at the start of the year and yearend (see chart).
Source: Bloomberg
Past performance is no guarantee of future results.
In both instances, a crucial factor was a substantial easing in long-term interest rates. The sluggish growth in Europe, coupled with expectations of near-zero earnings growth, couldn't solely account for such a surge in stock market indices.
A closer look reveals that the valuation effect, driven by falling interest rates, is the primary factor behind the remarkable rise in share prices in the eurozone. This effect is even more evident in the small-cap universe (+17% between November and December). However, prices in European small cap still stand 13% below those of January 2022 (see chart), whereas large caps stand just 2.3% off their level pre-Ukraine’s invasion.
What can be anticipated for 2024? Will the factors weighing on eurozone small caps for the past three years dissipate?
Eurozone economic growth is expected to rise, propelled by an increase in real wage growth and by a stabilization in Germany’s manufacturing sector. This improvement, spurred by internal factors, is likely to favour the small-cap segment, given its sensitivity to cyclical factors and greater exposure to domestic demand. Expected earnings growth for small caps in 2024 stands at around 14.5%, compared to the consensus forecast of 5.7% for the broader European index.
Moreover, a comparison of valuation multiples at the time of writing reveals a comparable price/earnings ratio, around 12 times expected earnings over the next 12 months, for both market segments. The absence of a valuation gap, unseen since the Great Depression, suggests that small-cap equities have more upside potential, contingent on a smooth realization of our macroeconomic scenario. The indication that the ECB is about to ease should be seen as a signal for those investors waiting to increase their exposure to this asset class.
However, caution is warranted. The ECB lacks sufficient evidence to consider an immediate cut in its key interest rates, with the persistence of core inflation and the expected cyclical improvement acting against such a move. Any change in the ECB's stance may not occur until the beginning of the second quarter, with a potential rate cut likely in the beginning of the third quarter. Exaggerated market reactions to monetary policy will continue to fuel volatility in bond markets and, notably, in the more volatile segments of equity markets like small caps.
Considering the factors outlined above, the small-cap market emerges as the most buoyant among European markets, with exposure to growth drivers, relative valuation, earnings growth in the European cycle, and a gradually less restrictive monetary environment. It's crucial to acknowledge that this assessment is contingent on decisions and communications from the ECB and the Fed, providing the green light for a return to this segment that appears to have emerged from a period of stagnation.
The provision of this material and/or reference to specific securities, sectors, or markets within this material does not constitute investment advice, or a recommendation or an offer to buy or to sell any security, or an offer of any regulated financial activity. Investors should consider the investment objectives, risks and expenses of any investment carefully before investing. The analyses, opinions, and certain of the investment themes and processes referenced herein represent the views of the portfolio manager(s) as of the date indicated. These, as well as the portfolio holdings and characteristics shown, are subject to change. There can be no assurance that developments will transpire as may be forecasted in this material. The analyses and opinions expressed by external third parties are independent and does not necessarily reflect those of Natixis Investment Managers. Past performance information presented is not indicative of future performance.
The STOXX® Europe 600 Index is derived from the STOXX® Europe Total Market Index (TMI) and is a subset of the STOXX® Global 1800 Index. With a fixed number of 600 components, the STOXX® Europe 600 Index represents large, mid and small capitalization companies across 18 countries of the European region: Austria, Belgium, Czech Republic, Denmark, Finland, France, Germany, Greece, Ireland, Italy, Luxembourg, the Netherlands, Norway, Portugal, Spain, Sweden, Switzerland and the United Kingdom.
The EURO STOXX 50 Index, Europe's leading Blue-chip index for the Eurozone, provides a Blue-chip representation of supersector leaders in the Eurozone. The index covers 50 stocks from 12 Eurozone countries: Austria, Belgium, Finland, France, Germany, Greece, Ireland, Italy, Luxembourg, the Netherlands, Portugal and Spain.
All investing involves risk, including the risk of loss. Investment risk exists with equity, fixed income, and alternative investments. There is no assurance that any investment will meet its performance objectives or that losses will be avoided. Investors should fully understand the risks associated with any investment prior to investing.
6327394.1.1
 2024 Private Assets Report
 Investment Outlook: Loomis Sayles
 Direct Indexing: Checking the Box
 Tax Management Update – Q1 2024