


Tax Management Update – 4Q 2023
Although the overall market was up fairly substantially in 2023, notable periods of volatility provided investors with opportunities to harvest losses.
Equity markets ended the year on a high note, with stocks rising dramatically during the fourth quarter. The sharp increase in the markets was driven by a number of factors, perhaps most notably the expectation that the Federal Reserve (Fed) is finished with its interest rate increase program. Although both short-term and long-term rates ended 2023 at levels that were very close to where they began the year, rates have come down fairly dramatically from the 15+ year highs we saw in October.
In Washington, there were a small number of near-term tax-related developments as both parties gear up for the 2024 elections. During Q4, the Senate and House avoided a government shutdown with a short-term funding bill that pushed any debt ceiling-related issues into 2024. Within the House, the Republicans also replaced Speaker Kevin McCarthy (CA) with Mike Johnson (LA). The leadership change could affect Congress’s approach to tax and spending initiatives including the FY 24–25 budget and aid requests for Ukraine, Israel, etc., but more significant changes will not likely take place until after the election.
Changes Coming to SECURE 2.0?
While little in the way of meaningful legislation is expected this year as Congress turns its attention to 2024 reelection campaigns, one moderately notable piece of draft legislation was published in early December that would make various amendments to SECURE 2.0. The goal of this legislation is to increase access to retirement savings. The changes would seemingly correct and enhance a number of areas within SECURE 2.0, including the expansion of Automatic Enrollment and adjusting the age for RMDs and catch-up contributions. But while many of the provisions have bipartisan support, the legislation may not ultimately be enacted, given Congress’s shrinking window to pass laws.
In terms of the candidates for president, Democrats are promoting higher taxes on the wealthy and corporations while most Republican candidates are arguing for lower tax rates for corporations and the middle class. Specifics from the various candidates will likely emerge in the coming months as we move through the primaries towards the general election. President Joe Biden (D) and former President Donald Trump (R) remain the favorites to win their respective party nominations, although we’re still a long way from the actual election.
Tax Case Reaches Supreme Court
Potentially as significant as the presidential tax policy platforms, the Moore v. United States Supreme Court case looms this fall. While the stakes of the actual case are relatively small ($15,000 in taxes are in question), the implications could be far-reaching. The case involves a provision of the Tax Cuts and Jobs Act (TCJA) that taxed corporate earnings that had accumulated overseas. If the court rules in favor of the plaintiffs, this has the potential to reduce tax revenues by over $300 billion. Any new precedent established could also affect other provisions of the tax code, both existing and proposed, that involve the taxation of unrealized income. Existing taxes on partnerships and pass-through entities, zero-coupon bonds, constructive sales, futures contracts and any other mark-to-market accounting could be impacted. Proposals put forth by Democrats, such as wealth taxes or the taxation of unrealized capital gains, could also be ruled out.
Strong Quarter for Stocks
Equity markets moved up fairly dramatically in the fourth quarter, which pushed the return for the S&P 500® into significantly positive territory for the full year. The strong performance of a handful of US large cap growth stocks continued to have an outsized impact on overall large cap index returns. The market did experience one 10.3% drawdown earlier in the year, but the strength throughout the rest of 2023 tended to move equity markets in a positive direction.
FIGURE 1: Annual Total Return and Max Drawdown for the S&P 500® by Calendar Year
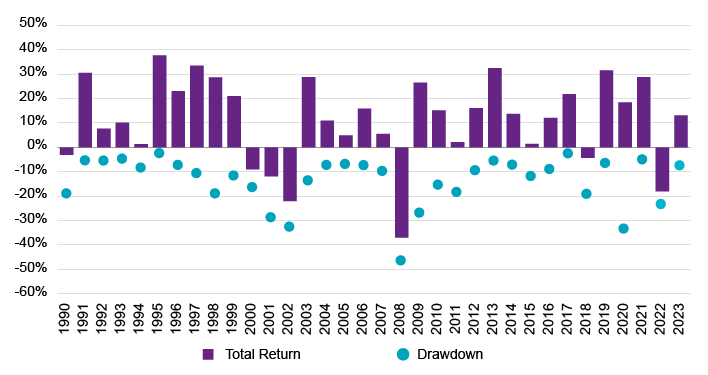
Source: FactSet, Natixis Investment Managers Solutions
Performance data shown represents past performance and is no guarantee of, and not necessarily indicative of, future results.
Winners and Losers
The number of stocks in the S&P 500® posting positive returns for the year increased from 50% at the end of Q3 to around 64% at the end of Q4. The overall return for the market through year-end is quite strong at over 26%, so it is not surprising that a good-sized majority of stocks ended the year up in value. In the past couple of decades, in years where the market is up 10%-15% the number of stocks with positive returns has tended to be around 75%. This is another illustration of the impact of some of the large cap growth stocks like Nvidia, Apple, Microsoft, etc. have had on creating a bit of a Tale of Two Cities market. It has been the best of times for a handful of stocks and, while not quite the worst of times for the rest of the market, it has definitely been a more challenging environment.
FIGURE 2: Winners, Losers and Total Return for the S&P 500® by Calendar Year
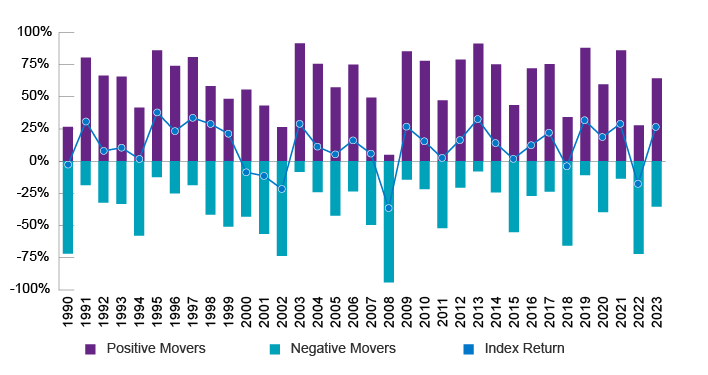
Source: FactSet, Natixis Investment Managers Solutions
Performance data shown represents past performance and is no guarantee of, and not necessarily indicative of, future results.
Returns for equity indices were notably positive during the period. For the quarter, most of the broad equity index returns increased by at least 10%, with large cap growth and small cap value being two of the top performing areas (rising 14.2% and 15.3% respectively). Emerging markets tended to lag relative to other equity markets during the period but still returned a solid 7.9%. Fixed income markets also rebounded nicely but did not enjoy as large an uptick in returns. The Bloomberg US Aggregate Bond Index rose around 6.8%, with other areas like high yield also enjoying strong performance. After peaking in October, interest rates dropped dramatically during the period, which was by far the largest driver of positive total returns for fixed income markets.
FIGURE 3: Year-to-Date Returns for Select Indexes (12/31/23)
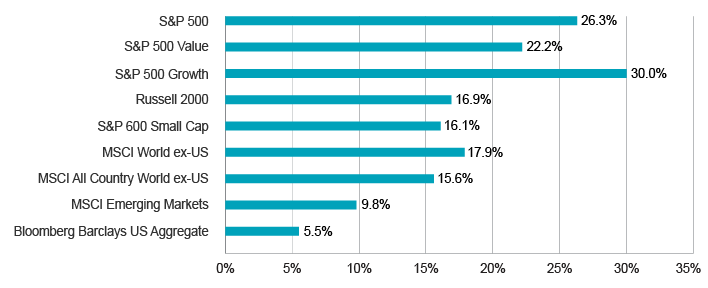
Source: FactSet
Performance data shown represents past performance and is no guarantee of, and not necessarily indicative of, future results.
Volatility Provided Loss Harvesting Opportunities
2023 represented an interesting year from a loss harvesting perspective. Although the overall market was up fairly substantially, there were notable periods of volatility that provided investors with opportunities to harvest losses. Dispersion of returns across individual companies was also fairly high, with approximately 36% of S&P 500® companies falling in value over the course of the entire year. This company-specific dispersion opened the door for additional loss harvesting for investments held in separately managed accounts. Harvesting opportunities varied quite a bit based on investor-specific events (when the client invested, cash flows, etc.) along with manager changes, but generally speaking, equity and fixed income portfolios tended to have ample opportunities to harvest losses over the course of the full year. Tax loss harvesting in Q4 did tend to slow down in the last half of December as equity markets approached all-time highs.
Resource
Tax Management Update Q4 2023
Read Full Update
Tax-Efficient Investing in Separately Managed Accounts (SMAs)
Direct Indexing SMAs can help address key issues facing tax-sensitive investors. All accounts are actively managed to optimize tax loss harvesting while providing beta exposure to an index. Our tax-managed SMAs include:
Learn More
Want more information on tax-managed investment strategies?
Contact Us
What Is Tax Loss Harvesting?
A portfolio can harvest its losses for tax purposes by selling investments when their current value is less than the price originally paid for the security. These losses can be used to offset other capital gains on an investor’s tax return. If there are excess losses, they can be used to offset up to $3,000 in ordinary income – or be banked for use in future years.
Capital gain is a rise in the value of a capital asset (investment or real estate) that gives it a higher worth than the purchase price.
S&P 500 Value: The index measures the performance of the large-capitalization value sector in the US equity market. It is a subset of the S&P 500 Index and consists of those stocks in the S&P 500 Index exhibiting the strongest value characteristics.
S&P 500 Growth: The index measures the performance of the large-capitalization growth sector in the US equity market. It is a subset of the S&P 500 Index and consists of those stocks in the S&P 500 Index exhibiting the strongest growth characteristics.
Russell 2000: Russell 2000® Index is an unmanaged index that measures the performance of the small-cap segment of the US equity universe. S&P 600 Small Cap: The S&P SmallCap 600 covers approximately 3% of the domestic equities market. Measuring the small-cap segment of the market that is typically renowned for poor trading liquidity and financial instability, the index is designed to be an efficient portfolio of companies that meet specific inclusion criteria to ensure that they are investable and financially viable.
MSCI World ex US: The MSCI World ex USA Index (Net) is an unmanaged index that is designed to measure the equity market performance of developed markets, excluding the United States.
MSCI All Country World ex US: The MSCI All Country World Index ex US is a free float-adjusted market capitalization index that is designed to measure equity market performance in the global developed (excluding the USA) and emerging markets. The index is shown with minimum dividend reinvested after deduction of withholding tax.
MSCI Emerging Markets: The MSCI Emerging Markets Index is an unmanaged index that is designed to measure the equity market performance of emerging markets.
Emerging Markets Index is an unmanaged index that is designed to measure the equity market performance of emerging markets.
Bloomberg Barclays U.S. Aggregate: The Bloomberg Barclays U.S. Aggregate Bond Index is an unmanaged index that covers the US-dollar-denominated, investment-grade, fixed-rate, taxable bond market of SEC-registered securities. The index includes bonds from the Treasury, government-related, corporate, mortgage-backed securities, asset-backed securities, and collateralized mortgage-backed securities sectors.
CFA® and Chartered Financial Analyst® are registered trademarks owned by the CFA Institute.
S&P 500® Index is a widely recognized measure of US stock market performance. It is an unmanaged index of 500 common stocks chosen for market size, liquidity, and industry group representation, among other factors. It also measures the performance of the large-cap segment of the US equities market.
The views and opinions expressed may change based on market and other conditions. This material is provided for informational purposes only and should not be construed as investment advice. There can be no assurance that developments will transpire as forecasted. Actual results may vary.
Indexes are not investments, do not incur fees and expenses and are not professionally managed. It is not possible to invest directly in an index.
Investing involves risk, including risk of loss. Investment risk exists with equity, fixed income, and alternative investments. There is no assurance that any investment will meet its performance objectives or that losses will be avoided.
This document may contain references to copyrights, indexes and trademarks that may not be registered in all jurisdictions. Third-party registrations are the property of their respective owners and are not affiliated with Natixis Investment Managers or any of its related or affiliated companies (collectively “Natixis”). Such third-party owners do not sponsor, endorse or participate in the provision of any Natixis services, funds or other financial products.
6198125.1.1
 Direct Indexing: Checking the Box
 Tax Management Update – Q1 2024

 All About The Rates
