


Psst… Check Out Small Cap Stocks
We’ve been hearing more interest in US small cap stocks lately, citing cheap valuations and a broadening of this year’s large cap tech rally. If you’ve been underweight small caps, now’s a good time to take a fresh look. They’ve underperformed large caps for the past five years – but we know that historically the opposite is true. Unbelievably, Apple Inc., with a $2,937 billion market capitalization, is nearly as large as the entire market capitalization ($2,978 billion) of the 1,997 small cap stocks in the Russell 2000 Index.1 Duly noted.
They’re Cheap, But That’s Not All
Small caps are cheap on both an absolute and relative basis. The S&P 600® small cap index is trading at a price/earnings ratio of 12.8x compared to its 10-year average of 18.2x. The discount is even starker when compared to the current P/E of the S&P 500® of 21.8x.1 While the Russell 2000® is a common proxy for small caps, we prefer the S&P 600® because it excludes unprofitable companies which account for over 40% of the Russell 2000 constituents.
Even so, cheap valuations alone aren’t enough to make an investment case (see: international stocks). It’s also helpful to evaluate positive momentum and technical support to avoid “value traps.” Fund flows point to optimism, with the Small Blend category in positive net flows through the first half of 2023 and accelerating since June. Certainly, investors are paying attention to the category’s outperformance in the last three months (+3% margin over large caps) as small companies start to eat into large caps’ 5% lead over the past year. The S&P 600® is safely trading above its 50-day moving average and has recently broken above its 200-day average, illustrating that technicals are also becoming more supportive.
US Small Cap Stocks Gaining Traction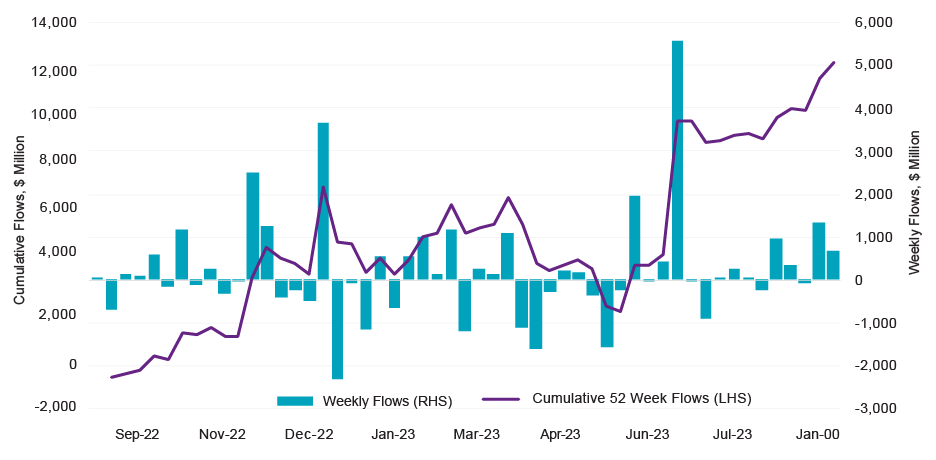
Source: Natixis Investment Managers Solutions; Bloomberg
Sentiment: Coming Off the Lows?
Also consider that sentiment in two important small cap sectors – Real Estate and Financials – may be bottoming, which could act as a springboard for returns if the news gets less bad. REITs and Financials both have a weighting that is 5% higher in the S&P 600® than the S&P 500®. Bank of America reports that fund managers are the most underweight REITs since the Lehman Brothers collapse in 2008. Concerns about higher interest rates, refinancing risk, and depressed asset values in commercial real estate have affected smaller regional banks too. Months after the collapse of Silicon Valley Bank, Moody’s cut the credit ratings of 10 regional banks and bank stocks have felt the impact.
The Tech Effect
Tech stocks are another reason why small caps have lagged their larger counterparts. Tech stocks account for 27% of the S&P 500® and gained 38% year to date through 8/18/23. Smaller tech companies account for just 13% of the S&P 600® and returned only 13% for the same period. The artificial intelligence-driven rally, fueled by names like Nvidia and Microsoft, has so far excluded small caps. Perhaps the market hasn’t yet come to appreciate the potential productivity gains smaller companies can achieve by incorporating AI into their businesses.
Weights and Measures: Comparison of S&P 500® and S&P 600® by Sector
| Weight | Price to Earnings | Year to Date Return (as of 8/18/2023) | |||||||
|---|---|---|---|---|---|---|---|---|---|
| S&P 600 | S&P 500 | Difference | S&P 600 | S&P 500 | S&P 600 | S&P 500 | |||
| Total | 100.0 | 100.0 | N/A | 12.9 | 22.3 | 4.9 | 15.1 | ||
| Financials | 17.4 | 12.7 | 4.7 | 9.8 | 13.6 | -7.8 | 2.8 | ||
| Industrials | 17.1 | 8.5 | 8.5 | 15.3 | 20.0 | 14.9 | 8.6 | ||
| Consumer Discretionary | 13.7 | 10.5 | 3.3 | 10.7 | 30.7 | 14.8 | 29.2 | ||
| Information Technology | 13.0 | 27.2 | -14.3 | 26.0 | 33.4 | 13.4 | 38.0 | ||
| Health Care | 10.3 | 13.7 | -3.4 | 23.1 | 26.9 | -8.1 | -0.9 | ||
| Real Estate | 7.6 | 2.5 | 5.2 | 30.2 | 32.2 | -4.4 | -0.2 | ||
| Materials | 5.6 | 2.5 | 3.1 | 14.9 | 17.4 | 8.1 | 5.0 | ||
| Energy | 5.5 | 4.6 | 0.9 | 5.1 | 9.4 | 10.9 | 3.0 | ||
| Consumer Staples | 4.9 | 6.7 | -1.7 | 17.9 | 24.3 | 6.9 | -0.1 | ||
| Communication Services | 2.9 | 8.7 | -5.7 | 7.9 | 25.4 | 8.2 | 38.2 | ||
| Utilities | 2.0 | 2.5 | -0.5 | 20.7 | 20.2 | -6.9 | -8.6 | ||
Source: Natixis Investment Managers Solutions; FactSet
Catching Our Breadth?
While narrow markets are treated with suspicion, we’ve found that market breadth tends to catch up to include more companies rather than prices catching down. When that narrowing is sharp like we’ve experienced this year, small caps have historically outperformed large caps to the tune of 8% over the subsequent six months.
Small Cap Outperformance Has Followed Narrow Market Breadth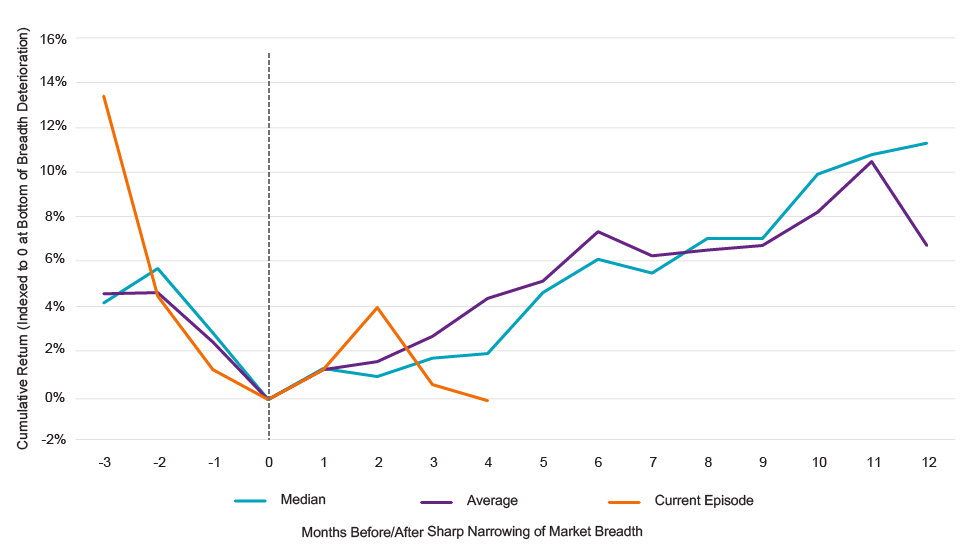
Source: Natixis Investment Managers Solutions; Bloomberg
What About Interest Rates?
The Fed’s hiking cycle is just about over, with futures markets predicting we’re 25–50bps from the terminal rate.2 Historically, the culmination of hikes has been good for small caps. In the 9-month period following the end of the Fed’s last four hiking cycles, the S&P 600® averaged double-digit gains.3 That’s consistent with our Cyclicality/Inflation framework where small caps tend to land in the “reflation” or “soft landing” quadrant where growth remains resilient.
Small Caps Have Rallied Following Rate Hike Cycles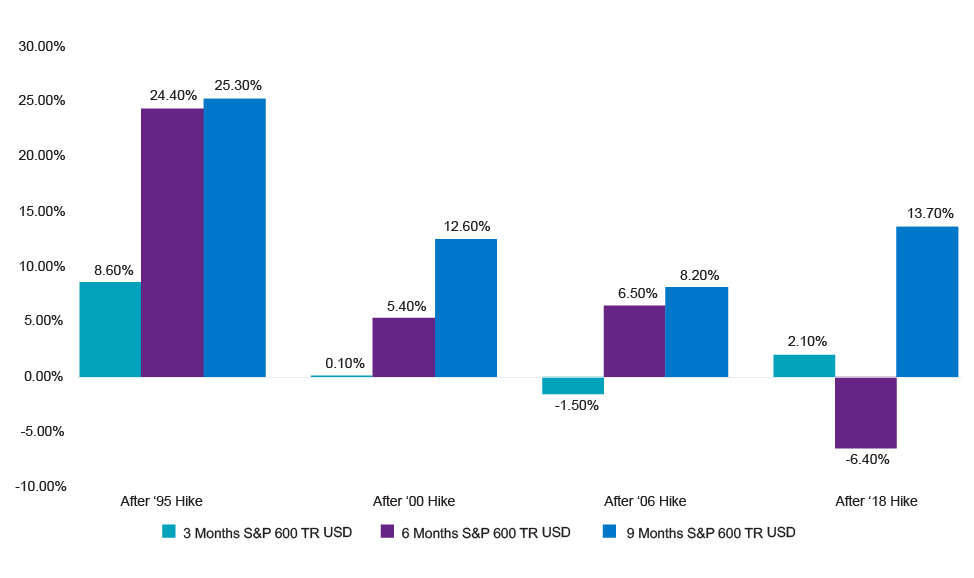
Source: Natixis Investment Managers Solutions; Morningstar
Other Potential Tailwinds for Small Caps
Catalysts are an important consideration when exploring out-of-favor parts of the market, and a resurgence of M&A activity, IPOs, and share buybacks would all be welcome catalysts for small caps. The start of an acquisition cycle from private equity firms, which are sitting on a record high $2.2 trillion in cash,4 would be a positive for depressed small cap valuations.
A growing body of evidence suggests now is a good time to consider adding – or adding to – small cap allocations. With the technical/momentum piece still improving, you may want to consider this as more of an alpha trade. Don’t buy broad-based exposure just yet. Instead, pick and choose your spots or hire an active manager to do so.
Active managers have navigated the small cap market quite well. We calculate that 57% of active Small Blend funds in the Morningstar universe beat their passive counterparts year to date through June. Over the previous 12 months that number improves to 71%, with average outperformance of 2.3%. In line with this thinking, the Natixis Investment Managers Solutions Investment Committee recently boosted its small cap exposure, citing broadening breadth and increasing odds of a soft landing supported by the Atlanta Fed’s GDPNow model estimating real GDP growth over 5% in the third quarter.
2 https://www.cmegroup.com/markets/interest-rates/cme-fedwatch-tool.html
3 Natixis Investment Managers Solutions
4 S&P Global Market Intelligence
CFA® and Chartered Financial Analyst® are registered trademarks owned by the CFA Institute.
The views and opinions (as of September 12, 2023) are those of the author and not Natixis Investment Managers or any of its affiliates. This discussion is for educational purposes and should not be considered investment advice.
Although Natixis Investment Managers believes the information provided in this material to be reliable, including that from third party sources, it does not guarantee the accuracy, adequacy, or completeness of such information.
This document may contain references to copyrights, indexes and trademarks that may not be registered in all jurisdictions. Third party registrations are the property of their respective owners and are not affiliated with Natixis Investment Managers or any of its related or affiliated companies (collectively “Natixis”). Such third-party owners do not sponsor, endorse or participate in the provision of any Natixis services, funds or other financial products.
Natixis Advisors, LLC provides advisory services through its division Natixis Investment Managers Solutions which is an affiliate of Natixis Investment Managers, LLC.
IMPORTANT INFORMATION: This communication is not intended to be distributed to, or used by, any person or entity in any jurisdiction or country where such access, distribution or use would be contrary to local law or regulation.
5953413.1.1


 Portfolio Construction Fundamentals