


Five Institutional Investment Trends – Midyear 2023


Natixis Investment Mangers Solutions portfolio consultants monitor asset classes, investment products, and market activity both in real time and from a historical perspective. Compelling institutional trends are summarized below.
1. Returns Recover, Dispersion Narrows. Performance recovered in Q4 2022 and Q1 2023, with nearly all institutional investment programs posting positive quarterly returns. With less dispersion between asset class returns, the difference between top and bottom quartile returns was largely tighter as well.
E&F Performance by Percentile || Public Performance by Percentile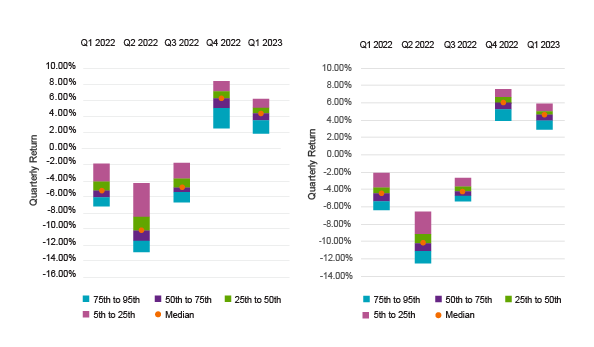
Source: Natixis Investment Managers Solutions, InvMetrics
Unicorn Valuation Growth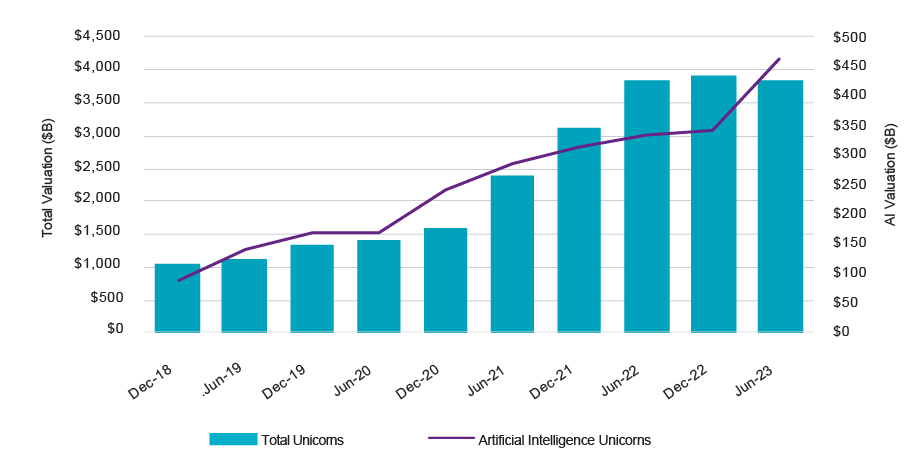
Source: Natixis Investment Managers Solutions, CB Insights
VIX vs. S&P 500 Monthly Option Premium Income || 1H 2023 Performance (Index = 100)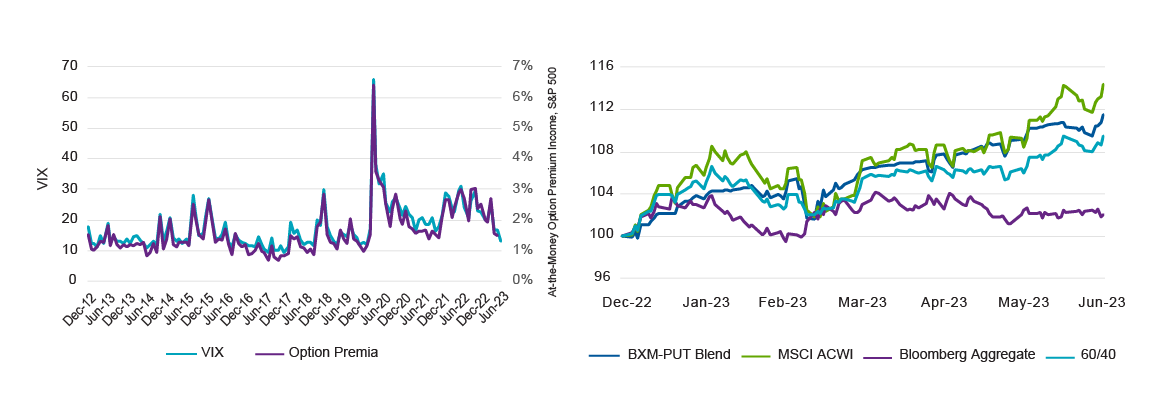
Source: Natixis Investment Managers Solutions, Bloomberg
Real Estate Allocations by Property Type, NFI, ODCE || REITs Industry Allocations, S&P 1500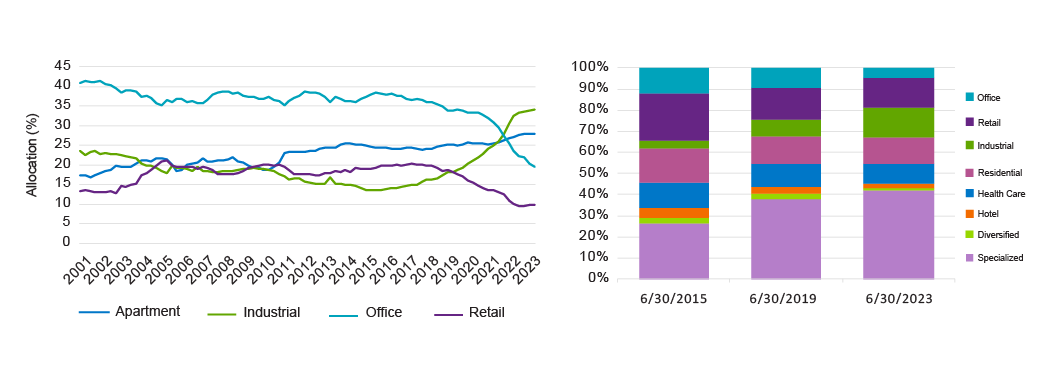
Source: NCREIF, FactSet
Average Cost Inflation Assumption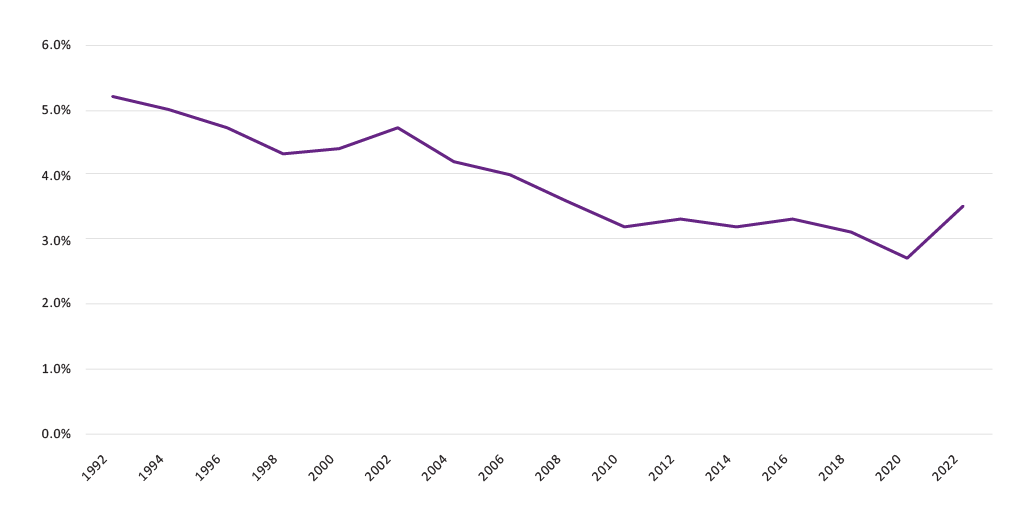
Source: NISA Investment Advisors, LLC (inflation assumptions), Nuclear Regulatory Commission/Holtec Decommissioning (extensions)
Institutional Investing Trends
This summary discusses recovering returns for institutional investors and soaring AI company valuations at midyear, while fears of WFH impact on office properties are realized.
Download PDF
Learn More
Interested to see how institutions’ funded status and asset levels will respond to 2023 market conditions?
Contact Us
This content is provided for informational purposes only and should not be construed as investment advice. Any opinions or forecasts contained herein reflect the subjective judgments and assumptions of the author only and do not necessarily reflect the views of Natixis Investment Managers, or any of its affiliates. There can be no assurance that developments will transpire as forecasted and actual results will be different. Data and analysis does not represent the actual or expected future performance of any investment product. We believe the information, including that obtained from outside resources, to be correct, but we cannot guarantee its accuracy. The information is subject to change at any time without notice.
The data contained herein is the result of analysis conducted by the Natixis Investment Managers Solutions consulting team on model portfolios submitted by Investment Professionals. The Moderate Peer Group consists of model portfolios that have been analyzed by the consulting team and have been designated as moderate by Investment Professionals.
Natixis Investment Managers Solutions collects portfolio data and aggregates that data in accordance with the peer group portfolio category that is assigned to an individual portfolio by the Investment Professionals. At such time that a Professional requests a report, the Professional will categorize the portfolios as a portfolio belonging to one of the following categories: Aggressive, Moderately Aggressive, Moderate, Moderately Conservative, or Conservative. The categorization of individual portfolios is not determined by Natixis Investment Managers Solutions as its role is solely as an aggregator of the pre-categorized portfolios. Please note that risk attributes of the Moderate Peer Group will change over time due to movements in the capital markets. Portfolio allocations provided to Natixis Investment Managers Solutions are static in nature and subsequent changes in a Professional’s portfolio allocations may not be reflected in the current Moderate Peer Group data.
Investing involves risk, including the risk of loss. Investment risk exists with equity, fixed income, international and emerging markets. Additionally, alternative investments, including managed futures, can involve a higher degree of risk and may not be suitable for all investors. There is no assurance that any investment will meet its performance objectives or that losses will be avoided.
This document may contain references to copyrights, indexes and trademarks that may not be registered in all jurisdictions. Third-party registrations are the property of their respective owners and are not affiliated with Natixis Investment Managers or any of its related or affiliated companies (collectively “Natixis”). Such third-party owners do not sponsor, endorse or participate in the provision of any Natixis services, funds or other financial products.
Index information contained herein is derived from third parties and is provided on an “as is” basis. The user of this information assumes the entire risk of use of this information. Each of the third-party entities involved in compiling, computing or creating index information disclaims all warranties (including, without limitation, any warranties of originality, accuracy, completeness, timeliness, non-infringement, merchantability and fitness for a particular purpose) with respect to such information.
CFA® and Chartered Financial Analyst® are registered trademarks owned by the CFA Institute.
5796693.1.1

 All About The Rates