


Bright Spot: Emerging Market Small Cap Stocks
In the face of global monetary tightening, equity markets have exhibited a robust rebound over the past year. But international equities, often considered riskier than US equities, tend to lag in tighter financial condition regimes. That has largely played out, with the S&P 500® delivering nearly a 14% return over the past 12 months, while international developed gained 9.5% and emerging markets (EM) lagged far behind, returning just 4%. However, taking a closer look reveals an unexpected outlier, in the form of emerging market small cap stocks (Figure 1).
EM small capitalization stocks have defied conventional wisdom, showcasing exceptional returns of nearly 17% over the past year – outpacing even the S&P 500®. This is particularly surprising given that US small cap equities have struggled relative to US large caps, underperforming by almost 16%. Meanwhile, emerging market small caps have outperformed their EM large cap counterparts by approximately 12% (Figure 2). This divergence prompts a deeper exploration into the factors driving this unexpected phenomenon.
One of the key drivers behind the outperformance of emerging small caps lies in country allocation, with China playing a pivotal role. Just 7% of the EM small cap index is allocated to Chinese companies, while they account for a substantial 26% of the EM large cap index (Figure 3). The sentiment around China has been deeply negative as the country grapples with a property sector crisis, an economic reopening petering out, and uninspiring monetary and fiscal stimulus. This has certainly weighed on performance of Chinese equities relative to broader emerging markets.
Another factor driving relative capitalization performance is the strength of the US dollar. In general, a stronger dollar poses challenges for emerging market equities for two reasons: heightened debt burdens and disruptions in global trade dynamics.
Concerning debt burdens, when a foreign company borrows in US dollars and the dollar strengthens, their debt burden increases in terms of their local currency. Large cap companies tend to have better access to international financial markets than small cap companies, and as a result, large cap EM companies are likely to borrow more in US dollars. This gives larger companies greater exposure to this currency headwind.
Regarding global trade dynamics, changes in the US dollar can be disruptive. Roughly half of global trade, and three-fourths of Asia-Pacific trade, is settled in dollars. Large cap EM companies, with their greater integration into global supply chains and trade networks, are more exposed to this dynamic than more domestically focused small cap companies. Evidence suggests a relationship between EM foreign currency weakness (USD strength) and the outperformance of small cap EM equities over the last year (Figure 4).
When adjusting portfolio allocations, the focus has traditionally been on overweighting or underweighting broad emerging market equities. However, bright spots like we’ve seen in emerging market small caps emphasize the importance of considering the makeup of your EM allocation. As we’ve seen this year, the composition of the allocation can be even more crucial than the decision to overweight or underweight.
CFA® and Chartered Financial Analyst® are registered trademarks owned by the CFA Institute.
The views and opinions (as of December 4, 2023) are those of the author(s) and not Natixis Investment Managers or any of its affiliates. This discussion is for educational purposes and should not be considered investment advice.
All investing involves risk, including the risk of loss. Investment risk exists with equity, fixed income, and alternative investments. There is no assurance that any investment will meet its performance objectives or that losses will be avoided. Investors should fully understand the risks associated with any investment prior to investing.
Performance data shown represents past performance and is no guarantee of, and not necessarily indicative of, future results.
Although Natixis Investment Managers believes the information provided in this material to be reliable, including that from third party sources, it does not guarantee the accuracy, adequacy, or completeness of such information.
This document may contain references to copyrights, indexes and trademarks that may not be registered in all jurisdictions. Third party registrations are the property of their respective owners and are not affiliated with Natixis Investment Managers or any of its related or affiliated companies (collectively “Natixis”). Such third-party owners do not sponsor, endorse or participate in the provision of any Natixis services, funds or other financial products.
Natixis Advisors, LLC provides advisory services through its division Natixis Investment Managers Solutions which is an affiliate of Natixis Investment Managers, LLC.
Figure 1 – Trailing One-Year Total Returns (12/1/22–12/1/23)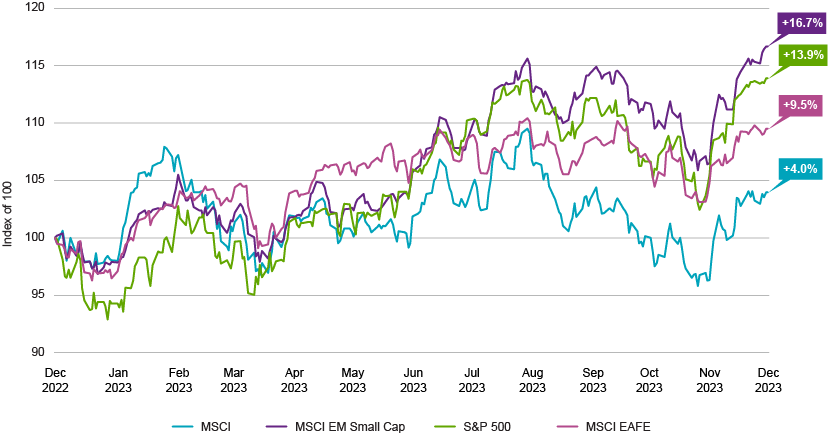
Source: FactSet
EM small capitalization stocks have defied conventional wisdom, showcasing exceptional returns of nearly 17% over the past year – outpacing even the S&P 500®. This is particularly surprising given that US small cap equities have struggled relative to US large caps, underperforming by almost 16%. Meanwhile, emerging market small caps have outperformed their EM large cap counterparts by approximately 12% (Figure 2). This divergence prompts a deeper exploration into the factors driving this unexpected phenomenon.
Figure 2 – EM Small Caps Outperforming EM Large Caps (12/1/22–12/1/23)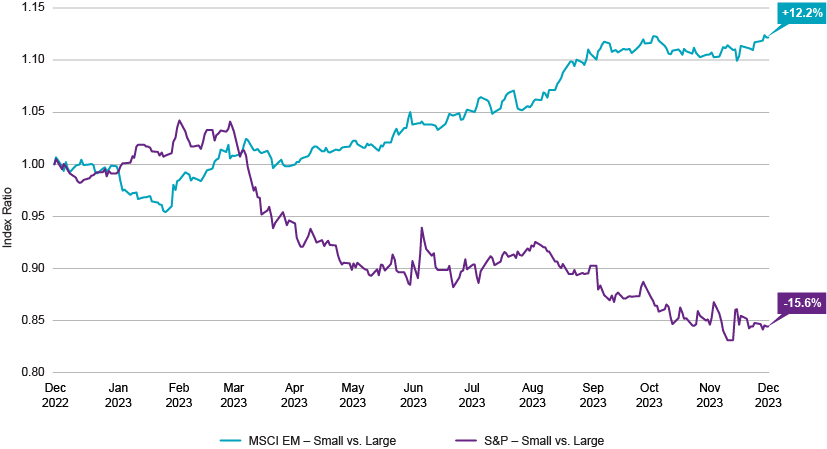
Source: FactSet
One of the key drivers behind the outperformance of emerging small caps lies in country allocation, with China playing a pivotal role. Just 7% of the EM small cap index is allocated to Chinese companies, while they account for a substantial 26% of the EM large cap index (Figure 3). The sentiment around China has been deeply negative as the country grapples with a property sector crisis, an economic reopening petering out, and uninspiring monetary and fiscal stimulus. This has certainly weighed on performance of Chinese equities relative to broader emerging markets.
Figure 3 – Chinese Companies Are a Much Smaller Part of the EM Small Cap Index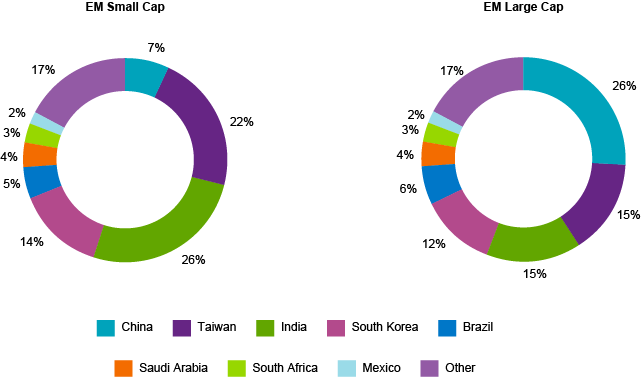
Source: Bloomberg
Another factor driving relative capitalization performance is the strength of the US dollar. In general, a stronger dollar poses challenges for emerging market equities for two reasons: heightened debt burdens and disruptions in global trade dynamics.
Concerning debt burdens, when a foreign company borrows in US dollars and the dollar strengthens, their debt burden increases in terms of their local currency. Large cap companies tend to have better access to international financial markets than small cap companies, and as a result, large cap EM companies are likely to borrow more in US dollars. This gives larger companies greater exposure to this currency headwind.
Regarding global trade dynamics, changes in the US dollar can be disruptive. Roughly half of global trade, and three-fourths of Asia-Pacific trade, is settled in dollars. Large cap EM companies, with their greater integration into global supply chains and trade networks, are more exposed to this dynamic than more domestically focused small cap companies. Evidence suggests a relationship between EM foreign currency weakness (USD strength) and the outperformance of small cap EM equities over the last year (Figure 4).
Figure 4 – Small Cap EM Relative Value vs. EM Foreign Exchange (FX) – Indexed to 100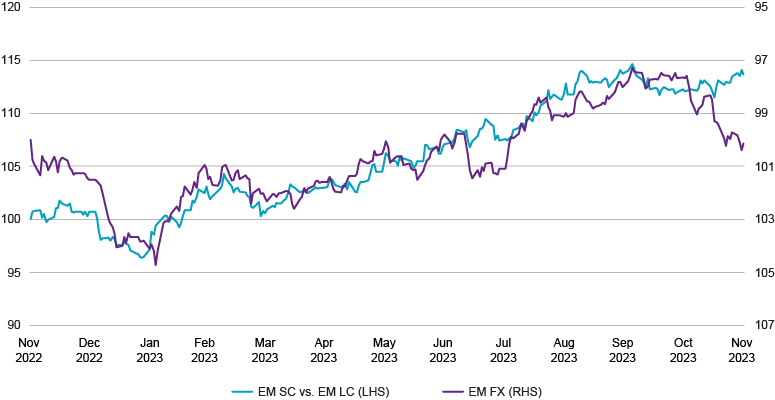
Source: FactSet
When adjusting portfolio allocations, the focus has traditionally been on overweighting or underweighting broad emerging market equities. However, bright spots like we’ve seen in emerging market small caps emphasize the importance of considering the makeup of your EM allocation. As we’ve seen this year, the composition of the allocation can be even more crucial than the decision to overweight or underweight.
The views and opinions (as of December 4, 2023) are those of the author(s) and not Natixis Investment Managers or any of its affiliates. This discussion is for educational purposes and should not be considered investment advice.
All investing involves risk, including the risk of loss. Investment risk exists with equity, fixed income, and alternative investments. There is no assurance that any investment will meet its performance objectives or that losses will be avoided. Investors should fully understand the risks associated with any investment prior to investing.
Performance data shown represents past performance and is no guarantee of, and not necessarily indicative of, future results.
Although Natixis Investment Managers believes the information provided in this material to be reliable, including that from third party sources, it does not guarantee the accuracy, adequacy, or completeness of such information.
This document may contain references to copyrights, indexes and trademarks that may not be registered in all jurisdictions. Third party registrations are the property of their respective owners and are not affiliated with Natixis Investment Managers or any of its related or affiliated companies (collectively “Natixis”). Such third-party owners do not sponsor, endorse or participate in the provision of any Natixis services, funds or other financial products.
Natixis Advisors, LLC provides advisory services through its division Natixis Investment Managers Solutions which is an affiliate of Natixis Investment Managers, LLC.
6143410.1.1

 All About The Rates

 Portfolio Construction Fundamentals