


Growth Is Where You Find It: A Look at 2024 Earnings Growth
Secular, cyclical or defensive?
Let’s first distinguish between cyclical and secular earnings growth. Some industries tend to be tied more tightly to the business cycle while other industries and sectors experience secular growth. Technology is often thought of as secular growth while Energy, Materials and Industrials can be more cyclical because these companies are more dependent on the business cycle. A different example is an industry within Technology, such as Semiconductors, which can be very sensitive to the business cycle, but is also part of a secular growth sector and trend.
During 2023, much of the world experienced slowing – yet still positive – economic growth. The recession that many prognosticators called for has not materialized, yet. While corporate sales and earnings are definitely affected by general macro conditions, the impact varies by industry and sector. Figure 1 categorizes these sectors in the MSCI World Index as Secular, Cyclical or Defensive. This framework is not perfect, as highlighted above. Even so, it can be argued that Technology and Communication Services are secular businesses, as continued population growth and improving living standards support a positive growth case for consumer spending, even though consumers are clearly susceptible to a downturn in the economy. On the other hand, Consumer Staples and Utilities tend to be defensive and less sensitive to the business or economic cycle, and parts of healthcare can be defensive.
Figure 1 – Analyst Net Income Estimates for Companies within the MSCI World Index, by Sector
| CY 2023 | CY 2024 | |||||
|---|---|---|---|---|---|---|
| Name | Net Income |
% of Net Income |
Growth |
Net Income |
Growth |
Contribution to Growth |
| MSCI World Index | 3,191,590 | 0.0 | 3,508,840 | 9.9 | ||
| Secular | 1,027,284 | 32.2% | 1,176,684 | 4.9% | ||
| Information Technology | 460,221 | 14.4% | 5.2 | 534,879 | 16.2 | 2.5% |
| Communication Services | 235,395 | 7.4% | 22.8 | 275,531 | 17.1 | 1.3% |
| Consumer Discretionary | 331,668 | 10.4% | 29.3 | 366,274 | 10.4 | 1.1% |
| Cyclical | 1,456,191 | 45.6% | 1,541,344 | 16.2 | 2.6% | |
| Energy | 294,502 | 9.2% | -29.2 | 298,686 | 1.4 | 0.1% |
| Materials | 145,961 | 4.6% | -31.6 | 153,757 | 5.3 | 0.2% |
| Financials | 688,958 | 21.6% | 14.2 | 733,282 | 6.4 | 1.3% |
| Industrials | 326,770 | 10.2% | 5.5 | 355,619 | 8.8 | 0.9% |
| Defensive | 708,118 | 22.2% | 790,817 | 16.2 | 2.7% | |
| Health Care | 353,514 | 11.1% | -15.0 | 412,080 | 16.6 | 1.9% |
| Consumer Staples | 183,904 | 5.8% | 1.2 | 197,927 | 7.6 | 0.4% |
| Utilities | 100,277 | 3.1% | 4.1 | 107,149 | 6.9 | 0.2% |
| Real Estate | 70,423 | 2.2% | 0.5 | 73,661 | 4.6 | 0.1% |
Source: FactSet, December 4, 2023
Broad earnings in 2023 declined slightly, but there was wide dispersion across sectors
Total net income for the MSCI World index, which represents all developed countries, is expected to be down 1% in 2023 compared to 2022, based on current estimates. Those earnings should come in at about $3 trillion based on actual results and current estimates for the fourth quarter of 2023. For perspective, total sales for all of the companies in this index are estimated to be $30.6 trillion for 2023, up 1.5% from 2022.
That said, when we look more closely, some sectors experienced strong earnings growth this year, such as Consumer Discretionary (+29%), Communications (+22.8%) and Financials (+14%). Others, such as Energy and Materials which tend to be very cyclical, saw a large decline in earnings, primarily due to prices moving lower as inflation came down and growth slowed. Defensive sectors and Technology tended to experience slow growth in 2023, but in the case of Technology, that was coming off the accelerated growth that these companies experienced during Covid. Similarly, within Healthcare, Pharmaceuticals and Biotechnology experienced a decline in growth as so much of that was pulled forward during the pandemic.
Going forward, earnings are expected to be driven by secular and some areas within cyclicals
As we now turn to 2024 to assess where to invest, Figure 2 makes it clear that expectations for the strongest earnings growth are in the Technology, Communication Services and Healthcare sectors. Within Technology, not surprisingly, that is driven by Semiconductor and Software growth. Interactive Media Services, an industry within Communication Services, is dominated by Alphabet and Meta, two companies expected to grow meaningfully in 2024. Within Healthcare, new pharmaceutical drugs related to diabetes and weight loss are expected to power growth. In fact, Danish company Novo Nordisk is the largest driver of net income within the MSCI Denmark component of the index.
Figure 2 – Analyst Net Income Estimates for Companies within the MSCI World Index, by Country
| CY 2023 | CY 2024 | |||||
|---|---|---|---|---|---|---|
| Name | Net Income Est |
% of Net Income |
Growth |
Net Income |
Growth |
Contribution to Growth |
| MSCI World Index | 3,191,593 | -1.3% | 3,508,840 | 9.9 | ||
| United States | 1,986,950 | 62.3% | 1.6 | 2,221,880 | 11.8 | 7.5% |
| Japan | 270,866 | 8.5% | 13.8 | 298,362 | 10.2 | 0.9% |
| Canada | 144,980 | 4.5% | -9.3 | 158,231 | 9.1 | 0.4% |
| Germany | 141,156 | 4.4% | -2.9 | 151,311 | 7.2 | 0.3% |
| United Kingdom | 140,241 | 4.4% | -14.3 | 144,293 | 2.9 | 0.1% |
| France | 114,988 | 3.6% | -7.2 | 120,969 | 5.2 | 0.2% |
| Italy | 70,219 | 2.2% | 14.4 | 69,050 | -1.7 | 0.0% |
| Switzerland | 54,060 | 1.7% | -4.2 | 59,926 | 10.9 | 0.2% |
| Spain | 50,404 | 1.6% | 9.5 | 52,290 | 3.7 | 0.1% |
| Sweden | 37,669 | 1.2% | 16.2 | 41,634 | 10.5 | 0.1% |
Source: FactSet, December 4, 2023
Earnings growth expectations for the MSCI US Index are strong, at just under 12%. You can see this in the country breakdown, but also in the earnings evolution chart (Figure 3). So the best earnings growth is expected to come from the US, with mid-single-digit earnings growth coming from MSCI Europe and MSCI EAFE.
Figure 3 – 2024 Earnings Growth Estimate Evolution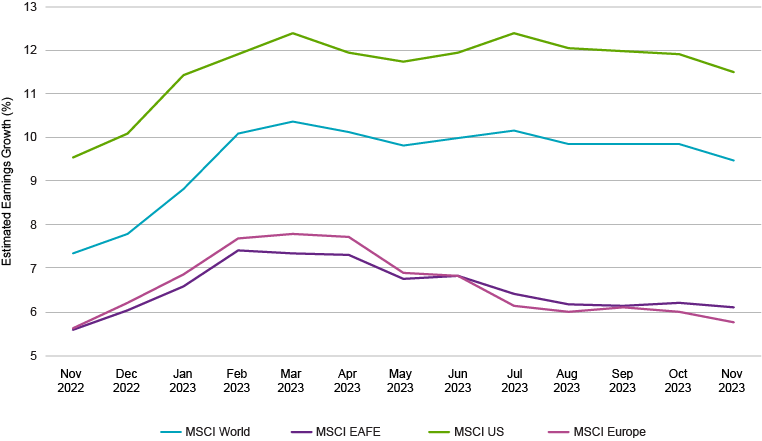
Source: FactSet
This material is provided for informational purposes only and should not be construed as investment advice. The views and opinions contained herein reflect the subjective judgments and assumptions of the authors only and do not necessarily reflect the views of Natixis Investment Managers, or any of its affiliates. The views and opinions are as of December 7, 2023 and may change based on market and other conditions. There can be no assurance that developments will transpire as forecasted, and actual results may vary.
All investing involves risk, including the risk of loss. Investment risk exists with equity, fixed income, and alternative investments. There is no assurance that any investment will meet its performance objectives or that losses will be avoided. Investors should fully understand the risks associated with any investment prior to investing.
Indexes are not investments, do not incur fees and expenses and are not professionally managed. It is not possible to invest directly in an index.
This material may not be redistributed, published, or reproduced, in whole or in part. Although Natixis Investment Managers believes the information provided in this material to be reliable, including that from third party sources, it does not guarantee the accuracy, adequacy or completeness of such information.
This document may contain references to copyrights, indexes and trademarks that may not be registered in all jurisdictions. Third party registrations are the property of their respective owners and are not affiliated with Natixis Investment Managers or any of its related or affiliated companies (collectively “Natixis”). Such third-party owners do not sponsor, endorse or participate in the provision of any Natixis services, funds or other financial products.
6151849.1.1
 2024 Private Assets Report

 All About The Rates