


Revalidating the Case for Duration in Fixed Income Portfolios
Fed funds futures pricing provides a fascinating signal into market expectations for interest rates. It now appears that investors largely think the Fed is done hiking, with baseline expectations favoring a pause or potentially one more rate hike between now and December. If true, we’re about to enter the second round of Fed policy uncertainty: the amount of time until we move away from restrictive levels. Could we start seeing rate cuts in one of the three remaining meetings in 2023? Early 2024? Late 2024? The yield curve remains massively inverted, with 3-month T-bills outyielding 10-year Treasury bonds by 1.5%. Let’s look beyond the noise of the immediate future and think about what the yield curve might look like as of year-end 2024, just over 16 months from now, by which time some normalization is likely.
Fed vs. Inflation
Could the battle to contain inflation be over by year-end 2024? The market seems to think so. Headline CPI has quickly fallen to 3.0%, although the favorable base effects of the past few months have mostly played out. While there could be some noise over the next few months, disinflationary housing pressures should drive this number lower by year-end 2024.
Attention for the next few months might shift to Core PCE (a measure of prices that people living in the US pay for goods and services), the Fed’s preferred inflation metric, where more progress is still needed. Core PCE is now 4.1%. With some more helpful base effects over the next few months, that number should move slightly lower. If we start to see smaller month-over-month inflation prints, we could get to the mid-two’s by 12/31/2024. Inflation expectations over five and ten years are now hovering around 2.5%, in line with this range. A far cry from where we were just six months ago. More importantly, inflation expectations around 2.5% means that real rates (nominal rates minus inflation expectations) are really high vs. history. Why would the Fed keep rates this restrictive for 16 more months?
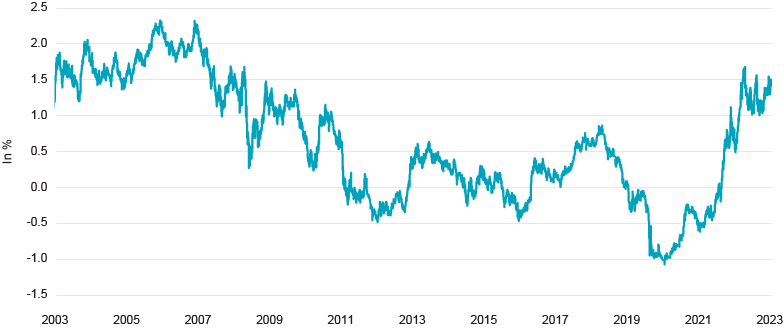
Source: Federal Reserve
The 12/31/2024 Yield Curve
The pace of cuts over the next few years will determine the front end of the yield curve. Right now, the market is expecting five to six cuts between now and the end of 2024. But the range of possible outcomes is wide, perhaps as few as one and as many as nine. Note that the market currently assigns zero probability that the fed funds rate remains at current levels by 12/31/2024. While plenty can change between now and then, current expectations indicate that it’s not whether we see cuts, but how many.
The Fed’s decision to ultimately start cutting rates doesn’t require waiting for a recession to stimulate. The Fed also doesn’t need to wait for inflation to hit the 2% goal to start cutting. The delayed policy response of Fed decisions would introduce too large a risk of an overcorrection to wait until then. At some point, the Fed might say there is no need to maintain restrictive policy given that a lot of the inflation work has been done. You would likely see cuts start happening as soon as there is clear evidence that we are on the right track to get there, not once we’ve already passed the finish line. I find the low to middle end of the range, maybe three to six cuts by year-end 2024, highly plausible. If we head down that path, the short end of the yield curve might drop to 4.0% or so.
Meanwhile, the revised outlook on growth and inflation has implications for the shape of the long end of the yield curve. The Fed has hiked a LOT, inflation is showing signs of containment, and yet the growth backdrop is still resilient. Much has been written about the various reasons why the economy is less interest rate sensitive than in past cycles. If you’re one of the millions of homeowners with mortgage rates under 4% – or even better own your home with no mortgage at all – the 7-handle on 30-year mortgages hasn’t crimped your disposable income. If you haven’t needed to buy a used car in the past three years, the 40% higher price tag is someone else’s problem. Sure, a $17 salad at Sweetgreen is a tough concept to wrap my mind around, but I haven’t stopped eating vegetables yet.
Perhaps the 10-year Treasury falls back down to 3.5%. At 2.5% expected inflation, that’s a 1.0% real yield, much closer to the average over the past 20 years. We would still have an inverted curve, but less inverted. This would benefit bonds across the yield curve, with long duration outperforming. This could also lead to additional spread compression, with corporates in turn outperforming Treasuries.
Two Other Possible Outcomes: Higher for Longer, Recession
How might this go wrong? If inflation stays a bit stickier, perhaps we get the low end of the range of cuts. Maybe less than three cuts is the “higher for longer” scenario. The short end of the curve drops slightly, perhaps to 5.0%. The long end could drift a bit higher. We’ve already seen some modest steepening at the long end after the Bank of Japan modestly tweaked its yield curve control policy and the Treasury announced a spike in planned long duration issuance for Q3. Perhaps more of a term premium event than a growth and inflation event. Could the 10-year rise some more and get to 4.75% or even 5.00%? A flat yield curve of around 5% would suggest short duration outperforms, long duration bonds decline in price, but the cushion from much higher yields prevents this from becoming a meaningful loss scenario. And don’t forget those real yields: Nominal rates pushing up to close to 5% would imply a real yield of close to 2.5% – a figure investors haven’t seen in more than 20 years. The increased demand that real yields at those levels would command from both institutional and individual investors would likely serve as a self-governing mechanism to just how far long rates could back up.
What if the policy response delay is even longer than expected? If we get the negative growth surprise between now and year-end 2024, or possibly even a recession, duration helps even more. From the perspective of Fed cuts, this would have to be more dovish than the base case. Remember, five to six cuts is the market’s base case and the market’s base case is definitely not saying 100% chance of recession by year-end 2024 (note how well-behaved credit spreads have been). Maybe seven to nine cuts by 12/31/2024 is your mild recession scenario. The short end drops to 3.50% or so. Growth and inflation expectations likely drop quicker and the 10-year Treasury dips to 2.75%. The yield curve is still inverted, with the potential for more Fed rate cuts in 2025 if the recession progresses. Duration is your friend here. Spreads creep back up so Treasury bonds outperform corporate bonds, although both can do well in this type of environment.
The Case for Duration
Part 2 of this cycle may be just beginning. While the pace of interest rate cuts is highly uncertain, cuts are likely coming, and the direction of short rates should be lower by year-end 2024. The direction of the long end will likely be a verdict on this growth and inflation balancing act. I see duration working out in two out of three scenarios.
CFA® and Chartered Financial Analyst® are registered trademarks owned by the CFA Institute.
This material is provided for informational purposes only and should not be construed as investment advice. The views and opinions contained herein reflect the subjective judgments and assumptions of the authors only and do not necessarily reflect the views of Natixis Investment Managers, or any of its affiliates. The views and opinions are as of August 9, 2023 and may change based on market and other conditions. There can be no assurance that developments will transpire as forecasted, and actual results may vary.
All investing involves risk, including the risk of loss. Investment risk exists with equity, fixed income, and alternative investments. There is no assurance that any investment will meet its performance objectives or that losses will be avoided. Investors should fully understand the risks associated with any investment prior to investing.
This material may not be redistributed, published, or reproduced, in whole or in part. Although Natixis Investment Managers believes the information provided in this material to be reliable, including that from third party sources, it does not guarantee the accuracy, adequacy or completeness of such information.
This document may contain references to copyrights, indexes and trademarks that may not be registered in all jurisdictions. Third party registrations are the property of their respective owners and are not affiliated with Natixis Investment Managers or any of its related or affiliated companies (collectively “Natixis”). Such third-party owners do not sponsor, endorse or participate in the provision of any Natixis services, funds or other financial products.
Provided by Natixis Distribution, LLC, 888 Boylston St., Boston, MA 02199. Natixis Investment Managers includes all of the investment management and distribution entities affiliated with Natixis Distribution, LLC and Natixis Investment Managers S.A. Natixis Advisors, LLC provides advisory services through its division Natixis Investment Managers Solutions. Advisory services are generally provided with the assistance of model portfolio providers, some of which are affiliates of Natixis Investment Managers, LLC.
Fed vs. Inflation
Could the battle to contain inflation be over by year-end 2024? The market seems to think so. Headline CPI has quickly fallen to 3.0%, although the favorable base effects of the past few months have mostly played out. While there could be some noise over the next few months, disinflationary housing pressures should drive this number lower by year-end 2024.
Attention for the next few months might shift to Core PCE (a measure of prices that people living in the US pay for goods and services), the Fed’s preferred inflation metric, where more progress is still needed. Core PCE is now 4.1%. With some more helpful base effects over the next few months, that number should move slightly lower. If we start to see smaller month-over-month inflation prints, we could get to the mid-two’s by 12/31/2024. Inflation expectations over five and ten years are now hovering around 2.5%, in line with this range. A far cry from where we were just six months ago. More importantly, inflation expectations around 2.5% means that real rates (nominal rates minus inflation expectations) are really high vs. history. Why would the Fed keep rates this restrictive for 16 more months?
10Y Real Expected Funds Rate
Source: Federal Reserve
The 12/31/2024 Yield Curve
The pace of cuts over the next few years will determine the front end of the yield curve. Right now, the market is expecting five to six cuts between now and the end of 2024. But the range of possible outcomes is wide, perhaps as few as one and as many as nine. Note that the market currently assigns zero probability that the fed funds rate remains at current levels by 12/31/2024. While plenty can change between now and then, current expectations indicate that it’s not whether we see cuts, but how many.
The Fed’s decision to ultimately start cutting rates doesn’t require waiting for a recession to stimulate. The Fed also doesn’t need to wait for inflation to hit the 2% goal to start cutting. The delayed policy response of Fed decisions would introduce too large a risk of an overcorrection to wait until then. At some point, the Fed might say there is no need to maintain restrictive policy given that a lot of the inflation work has been done. You would likely see cuts start happening as soon as there is clear evidence that we are on the right track to get there, not once we’ve already passed the finish line. I find the low to middle end of the range, maybe three to six cuts by year-end 2024, highly plausible. If we head down that path, the short end of the yield curve might drop to 4.0% or so.
Meanwhile, the revised outlook on growth and inflation has implications for the shape of the long end of the yield curve. The Fed has hiked a LOT, inflation is showing signs of containment, and yet the growth backdrop is still resilient. Much has been written about the various reasons why the economy is less interest rate sensitive than in past cycles. If you’re one of the millions of homeowners with mortgage rates under 4% – or even better own your home with no mortgage at all – the 7-handle on 30-year mortgages hasn’t crimped your disposable income. If you haven’t needed to buy a used car in the past three years, the 40% higher price tag is someone else’s problem. Sure, a $17 salad at Sweetgreen is a tough concept to wrap my mind around, but I haven’t stopped eating vegetables yet.
Perhaps the 10-year Treasury falls back down to 3.5%. At 2.5% expected inflation, that’s a 1.0% real yield, much closer to the average over the past 20 years. We would still have an inverted curve, but less inverted. This would benefit bonds across the yield curve, with long duration outperforming. This could also lead to additional spread compression, with corporates in turn outperforming Treasuries.
Two Other Possible Outcomes: Higher for Longer, Recession
How might this go wrong? If inflation stays a bit stickier, perhaps we get the low end of the range of cuts. Maybe less than three cuts is the “higher for longer” scenario. The short end of the curve drops slightly, perhaps to 5.0%. The long end could drift a bit higher. We’ve already seen some modest steepening at the long end after the Bank of Japan modestly tweaked its yield curve control policy and the Treasury announced a spike in planned long duration issuance for Q3. Perhaps more of a term premium event than a growth and inflation event. Could the 10-year rise some more and get to 4.75% or even 5.00%? A flat yield curve of around 5% would suggest short duration outperforms, long duration bonds decline in price, but the cushion from much higher yields prevents this from becoming a meaningful loss scenario. And don’t forget those real yields: Nominal rates pushing up to close to 5% would imply a real yield of close to 2.5% – a figure investors haven’t seen in more than 20 years. The increased demand that real yields at those levels would command from both institutional and individual investors would likely serve as a self-governing mechanism to just how far long rates could back up.
What if the policy response delay is even longer than expected? If we get the negative growth surprise between now and year-end 2024, or possibly even a recession, duration helps even more. From the perspective of Fed cuts, this would have to be more dovish than the base case. Remember, five to six cuts is the market’s base case and the market’s base case is definitely not saying 100% chance of recession by year-end 2024 (note how well-behaved credit spreads have been). Maybe seven to nine cuts by 12/31/2024 is your mild recession scenario. The short end drops to 3.50% or so. Growth and inflation expectations likely drop quicker and the 10-year Treasury dips to 2.75%. The yield curve is still inverted, with the potential for more Fed rate cuts in 2025 if the recession progresses. Duration is your friend here. Spreads creep back up so Treasury bonds outperform corporate bonds, although both can do well in this type of environment.
The Case for Duration
Part 2 of this cycle may be just beginning. While the pace of interest rate cuts is highly uncertain, cuts are likely coming, and the direction of short rates should be lower by year-end 2024. The direction of the long end will likely be a verdict on this growth and inflation balancing act. I see duration working out in two out of three scenarios.
This material is provided for informational purposes only and should not be construed as investment advice. The views and opinions contained herein reflect the subjective judgments and assumptions of the authors only and do not necessarily reflect the views of Natixis Investment Managers, or any of its affiliates. The views and opinions are as of August 9, 2023 and may change based on market and other conditions. There can be no assurance that developments will transpire as forecasted, and actual results may vary.
All investing involves risk, including the risk of loss. Investment risk exists with equity, fixed income, and alternative investments. There is no assurance that any investment will meet its performance objectives or that losses will be avoided. Investors should fully understand the risks associated with any investment prior to investing.
This material may not be redistributed, published, or reproduced, in whole or in part. Although Natixis Investment Managers believes the information provided in this material to be reliable, including that from third party sources, it does not guarantee the accuracy, adequacy or completeness of such information.
This document may contain references to copyrights, indexes and trademarks that may not be registered in all jurisdictions. Third party registrations are the property of their respective owners and are not affiliated with Natixis Investment Managers or any of its related or affiliated companies (collectively “Natixis”). Such third-party owners do not sponsor, endorse or participate in the provision of any Natixis services, funds or other financial products.
Provided by Natixis Distribution, LLC, 888 Boylston St., Boston, MA 02199. Natixis Investment Managers includes all of the investment management and distribution entities affiliated with Natixis Distribution, LLC and Natixis Investment Managers S.A. Natixis Advisors, LLC provides advisory services through its division Natixis Investment Managers Solutions. Advisory services are generally provided with the assistance of model portfolio providers, some of which are affiliates of Natixis Investment Managers, LLC.
5872046.1.1
 Portfolio Construction Fundamentals

 Plan Ahead for Tighter Spreads