


Returns on Cash May Be Lower Than You Think
Why would I buy a 10-year Treasury at 3.75% when I can get 5% (or more) in cash? Given the inverted yield curve and the fairly attractive risk-free return one can seemingly lock in, many investors have happily collected their returns on cash and eschewed moving out in duration. But this may not be the best strategy right now.
We’ve talked about how a fixed income portfolio predominantly invested in money market funds and/or short duration Treasuries is a bet on stagflation – a bet that rates and spreads will both rise, as this is the only scenario where a portfolio like that is positioned to outperform. But some have suggested that the yield curve is so inverted and the cushion of 1% (or more) is enough not to worry about slightly underperforming in a minor falling rates scenario. There are a couple of problems with this narrative, and the difference in future expected returns between cash and duration-sensitive fixed income may be lower than you think.
Fine Print and Future Rates
First, you need to stay invested for an entire year to earn the headline T-bill yield, and the interest rate environment needs to remain exactly the same. A shorter-duration bond is going to subject you to reinvestment risk when it matures. A 6-month CD yielding 5% is really only going to return 2.5% – and leave you with another decision to make six months from now.
Second, the expectation is for short rates to fall over the next couple of years as the Federal Reserve either cuts because (a) inflation has moderated and there’s no reason to maintain restrictive policy, or (b) because we’re in a mild recession. This is essentially why the yield curve is inverted – because the expected path of cash is downward sloping. What’s not known is the exact pace of that declining return outlook for cash.
To crystallize this point, we’ve seen plenty of distortions around short-term cash returns and long-term cash returns. In early 2022, 1-month T-bills yielded 0%, while the market expected that policy rate increases would occur at some point over the next several years, equating to a 5-year cash return expectation of 1.5%–2.0% (quite the undershoot in retrospect). At the other extreme, at the end of May 2023, 1-month T-bill yields briefly eclipsed 6% as expectations for a June rate hike (which never materialized) combined with concerns around 11th hour US debt ceiling negotiations potentially driving the US to a first-ever default (which never materialized). T-bill yields quickly fell almost 1% during the first two weeks of June as these risk premiums were unwound.
Term Premium
So what is the baseline expected return from staying in cash? An important and sometimes less talked about component of Treasury yields is the term premium, or the additional yield that investors receive for holding interest rate risk. Strip out the term premium from current yields across the curve and you get a sense of the market’s expectation for the future path of cash. Looking at the average of the methodologies used by the Federal Reserve Banks of New York and San Francisco, the expected return from cash over the next five years is 4.50%. Certainly nothing to sneeze at considering how many years the expected return was close to 1%. But not 5%+ either.
The Long and Short of It
Bottom line? Short-term cash yields do not equate to long-term cash returns. If market expectations are right, returns on cash might be 0.75% lower than the headline figure, and investors can enhance returns by moving into core, core plus, and corporate strategies.
CFA® and Chartered Financial Analyst® are registered trademarks owned by the CFA Institute.
This material is provided for informational purposes only and should not be construed as investment advice. The views and opinions contained herein reflect the subjective judgments and assumptions of the authors only and do not necessarily reflect the views of Natixis Investment Managers, or any of its affiliates. The views and opinions are as of June 20, 2023 and may change based on market and other conditions. There can be no assurance that developments will transpire as forecasted, and actual results may vary.
All investing involves risk, including the risk of loss. Investment risk exists with equity, fixed income, and alternative investments. There is no assurance that any investment will meet its performance objectives or that losses will be avoided. Investors should fully understand the risks associated with any investment prior to investing.
This material may not be redistributed, published, or reproduced, in whole or in part. Although Natixis Investment Managers believes the information provided in this material to be reliable, including that from third party sources, it does not guarantee the accuracy, adequacy or completeness of such information.
This document may contain references to copyrights, indexes and trademarks that may not be registered in all jurisdictions. Third party registrations are the property of their respective owners and are not affiliated with Natixis Investment Managers or any of its related or affiliated companies (collectively “Natixis”). Such third-party owners do not sponsor, endorse or participate in the provision of any Natixis services, funds or other financial products.
Provided by Natixis Distribution, LLC, 888 Boylston St., Boston, MA 02199. Natixis Investment Managers includes all of the investment management and distribution entities affiliated with Natixis Distribution, LLC and Natixis Investment Managers S.A. Natixis Advisors, LLC provides advisory services through its division Natixis Investment Managers Solutions. Advisory services are generally provided with the assistance of model portfolio providers, some of which are affiliates of Natixis Investment Managers, LLC.
We’ve talked about how a fixed income portfolio predominantly invested in money market funds and/or short duration Treasuries is a bet on stagflation – a bet that rates and spreads will both rise, as this is the only scenario where a portfolio like that is positioned to outperform. But some have suggested that the yield curve is so inverted and the cushion of 1% (or more) is enough not to worry about slightly underperforming in a minor falling rates scenario. There are a couple of problems with this narrative, and the difference in future expected returns between cash and duration-sensitive fixed income may be lower than you think.
Fine Print and Future Rates
First, you need to stay invested for an entire year to earn the headline T-bill yield, and the interest rate environment needs to remain exactly the same. A shorter-duration bond is going to subject you to reinvestment risk when it matures. A 6-month CD yielding 5% is really only going to return 2.5% – and leave you with another decision to make six months from now.
Second, the expectation is for short rates to fall over the next couple of years as the Federal Reserve either cuts because (a) inflation has moderated and there’s no reason to maintain restrictive policy, or (b) because we’re in a mild recession. This is essentially why the yield curve is inverted – because the expected path of cash is downward sloping. What’s not known is the exact pace of that declining return outlook for cash.
To crystallize this point, we’ve seen plenty of distortions around short-term cash returns and long-term cash returns. In early 2022, 1-month T-bills yielded 0%, while the market expected that policy rate increases would occur at some point over the next several years, equating to a 5-year cash return expectation of 1.5%–2.0% (quite the undershoot in retrospect). At the other extreme, at the end of May 2023, 1-month T-bill yields briefly eclipsed 6% as expectations for a June rate hike (which never materialized) combined with concerns around 11th hour US debt ceiling negotiations potentially driving the US to a first-ever default (which never materialized). T-bill yields quickly fell almost 1% during the first two weeks of June as these risk premiums were unwound.
Term Premium
So what is the baseline expected return from staying in cash? An important and sometimes less talked about component of Treasury yields is the term premium, or the additional yield that investors receive for holding interest rate risk. Strip out the term premium from current yields across the curve and you get a sense of the market’s expectation for the future path of cash. Looking at the average of the methodologies used by the Federal Reserve Banks of New York and San Francisco, the expected return from cash over the next five years is 4.50%. Certainly nothing to sneeze at considering how many years the expected return was close to 1%. But not 5%+ either.
Current Cash vs. Expected Cash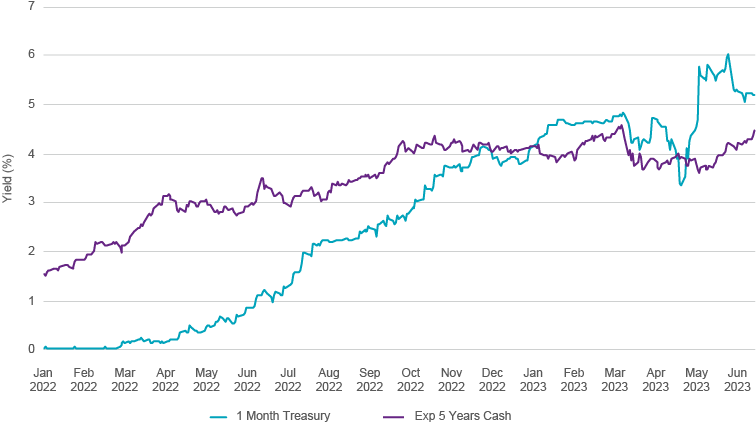
Source: Natixis Investment Managers Solutions, New York Federal Reserve Bank, San Francisco Federal Reserve Bank.
5-Year term premium represents an average of the New York and San Francisco figures.
The Long and Short of It
Bottom line? Short-term cash yields do not equate to long-term cash returns. If market expectations are right, returns on cash might be 0.75% lower than the headline figure, and investors can enhance returns by moving into core, core plus, and corporate strategies.
- If the market is wrong, and the yield curve readjusts downward, you’re going to want that duration exposure even more.
- If the market is wrong and inflation reaccelerates, the duration exposure might hurt, but the yield cushion is much higher now than it was at the start of the rate cycle.
This material is provided for informational purposes only and should not be construed as investment advice. The views and opinions contained herein reflect the subjective judgments and assumptions of the authors only and do not necessarily reflect the views of Natixis Investment Managers, or any of its affiliates. The views and opinions are as of June 20, 2023 and may change based on market and other conditions. There can be no assurance that developments will transpire as forecasted, and actual results may vary.
All investing involves risk, including the risk of loss. Investment risk exists with equity, fixed income, and alternative investments. There is no assurance that any investment will meet its performance objectives or that losses will be avoided. Investors should fully understand the risks associated with any investment prior to investing.
This material may not be redistributed, published, or reproduced, in whole or in part. Although Natixis Investment Managers believes the information provided in this material to be reliable, including that from third party sources, it does not guarantee the accuracy, adequacy or completeness of such information.
This document may contain references to copyrights, indexes and trademarks that may not be registered in all jurisdictions. Third party registrations are the property of their respective owners and are not affiliated with Natixis Investment Managers or any of its related or affiliated companies (collectively “Natixis”). Such third-party owners do not sponsor, endorse or participate in the provision of any Natixis services, funds or other financial products.
Provided by Natixis Distribution, LLC, 888 Boylston St., Boston, MA 02199. Natixis Investment Managers includes all of the investment management and distribution entities affiliated with Natixis Distribution, LLC and Natixis Investment Managers S.A. Natixis Advisors, LLC provides advisory services through its division Natixis Investment Managers Solutions. Advisory services are generally provided with the assistance of model portfolio providers, some of which are affiliates of Natixis Investment Managers, LLC.
5761177.1.1


 Portfolio Construction Fundamentals