Economic cycles more resilient than expected, with the inflationary shock now behind us.
August 11, 2026
-
9 min

Capabilities
Find out more about our investment capabilities
Services
Find out more about the full scope of our solutions offering

Funds by asset class
Search for funds within each asset class
Funds by investment manager
Find funds run by each of our affiliated investment managers
Insights by asset class
Gain our perspectives and investment thinking across each asset class
News and insights
Get deep insight and expert views on the forces shaping financial markets
Who we are
Find out more about who we are and how we might be able to help
Investor sentiment
Discover the latest insights from the center for investor insight


The conflict in the Middle East has created geopolitical uncertainty that has impacted global economies through higher energy commodity prices. Although this inflationary shock appeared to be easing following encouraging news about a potential peace agreement, recent developments in the region have once again made the situation precarious. Markets appear to have priced in the sustained reopening of the Strait of Hormuz, and fears of supply chain disruptions are fading. The decline in energy input prices is good news for dependent economies, particularly in Asia and Europe. However, global demand will remain resilient only if central banks recognize the transitory nature of the inflationary shock and if the U.S. administration provides the necessary political breathing room in the second half of the year – a period that will be shaped by the midterm elections. We can expect an economic divergence between the economies driving the investment cycle linked to the technological revolution in the United States and Asia, and those lagging behind in terms of technological transition, industrial development, and military sovereignty – particularly in Europe.
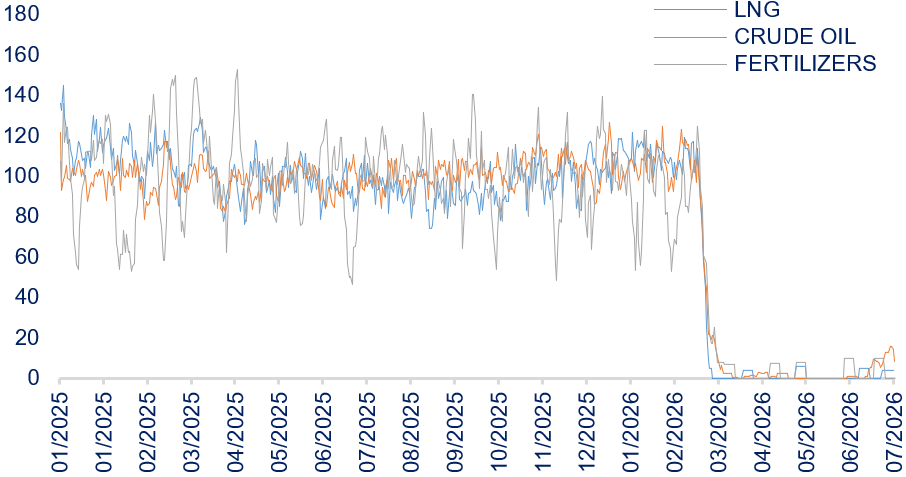
Reported information indicating a gradual reopening of the Strait of Hormuz and a cessation of hostilities in the Middle East has led to a significant drop in energy commodity prices. However, Figure 1 shows that the actual reopening of the strait is far from certain. Maritime shipments of oil, LNG, and fertilizer are still far from returning to their pre-conflict levels. Furthermore, the conflicting parties have entered a phase of negotiations in which a lasting peace agreement that satisfies all parties seems out of reach.
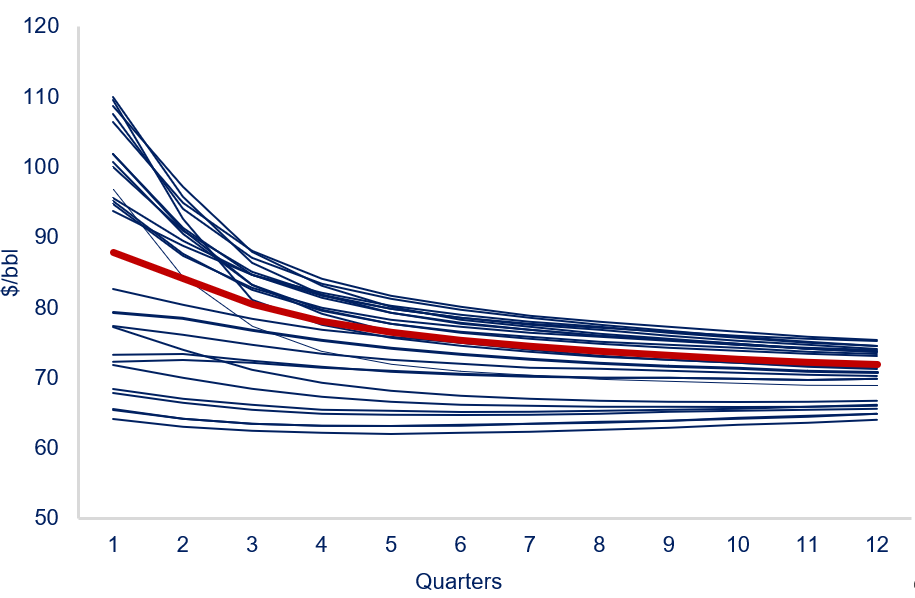
Nevertheless, the term structure of market expectations of Brent crude oil prices, as illustrated in Figure 2, has returned to its pre-conflict levels. This apparent inconsistency masks a fundamental reality. In addition to the energy bottleneck in the Strait of Hormuz and the pressure exerted, in particular, on Asian fuel reserves, the structural overcapacity of oil-producing countries – combined with declining oil consumption in their economies – is exerting downward pressure on long-term prices. This also explains why the market has not anticipated a long-term rise in prices (Figure 2). Furthermore, the stated intention of several OPEC countries to leave the cartel could, in the long term, free them from the organization’s production quotas and maintain downward pressure on crude oil prices.
Developed and emerging economies have thus experienced an exogenous shock to energy prices, without any quantity rationing. This shock is expected to lead to a temporary decline in the real incomes of households and businesses. Beyond the direct impact on input prices and transportation costs, second-round effects are not likely to materialize. This is particularly true for developed countries, whose economies are no longer in a recovery phase characterized by strong post-pandemic demand. Such a situation would have allowed the pressures arising from the start of the Russia-Ukraine conflict to spread more widely to the “rigid” components of the basket of goods – namely, services and manufactured goods.
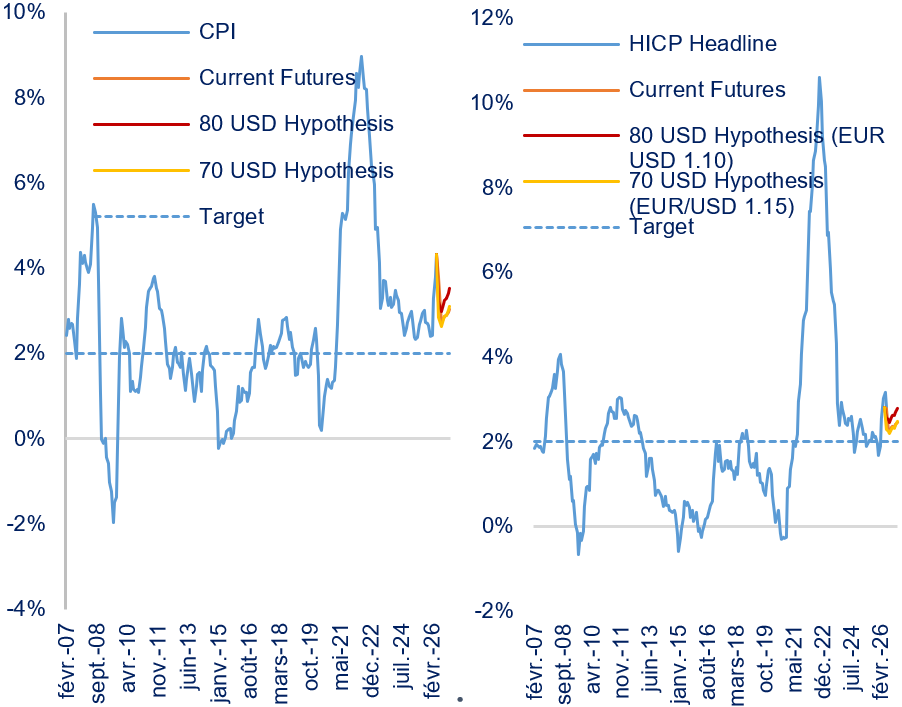
Figure 3 presents possible trajectories for the price per barrel over a one-year period (based on Brent futures contracts or scenarios in which the price stabilizes at $80 or $70 per barrel throughout the projection period) and their effect on year-over-year changes in the consumer price index in the United States and the euro area. For illustrative purposes only, we also consider downside risks to the EUR/USD exchange rate. These scenarios confirm that, under current conditions, the shock was purely transitory, despite its magnitude. However, the level at which the price per barrel ultimately stabilizes will be decisive for the pace of normalization of price dynamics. For example, a price of $70 per barrel over the course of the year would result in average annual growth rates of 2.3% and 3% for the Harmonized Consumer Price Index in the eurozone and the United States, respectively, in 2026. If prices were to remain around $80 for the rest of the year, inflation would rise to 2.5% and 3.2%, respectively.
The impact of this shock, stemming from volatile inflationary components, on services and high-priced goods will likely be only moderate on both sides of the Atlantic. The normalisation of labour market pressures and the associated slowdown in wage growth, coupled with falling tariffs in the United States, will exert downward pressure on the underlying index. An alternative way of gauging the extent of this pressure, particularly in Europe, is to measure the proportion of the goods and services in the basket used to calculate the Consumer Price Index that are rising at a certain rate. Figure 4 shows that almost half of inflationary components have a year-on-year rate of change below the central bank’s target. This is far from the levels observed in 2022. The proportion of components with a rate of change exceeding 10 per cent has been falling for the past two months.
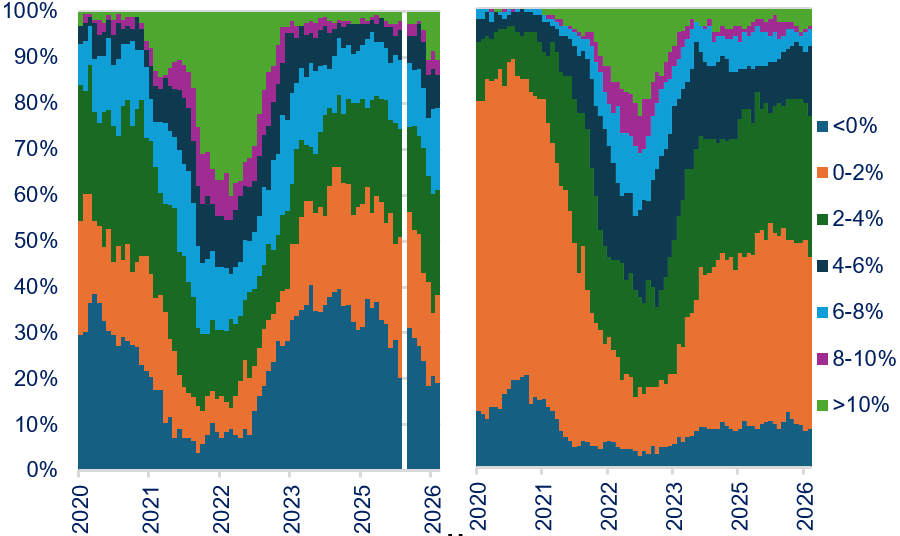
The situation in the United States is open to more debate, since the rise in prices is not rooted in the March 2026 energy shock. Clearly, a significant proportion of the goods and services in the basket are currently trading above the Federal Reserve’s target, at around 60 per cent. These pressures are likely to stem from strong domestic demand and residual price effects, which are expected to subside in the second half of the year.
We remain positive about the outlook for global growth, driven by the substantial investment required for the ongoing technological transition. Regional growth trajectories will depend primarily on investment in 2026 and 2027, as illustrated in Figure 5, which shows investment trends in new information and communication technologies, as well as intellectual property products.
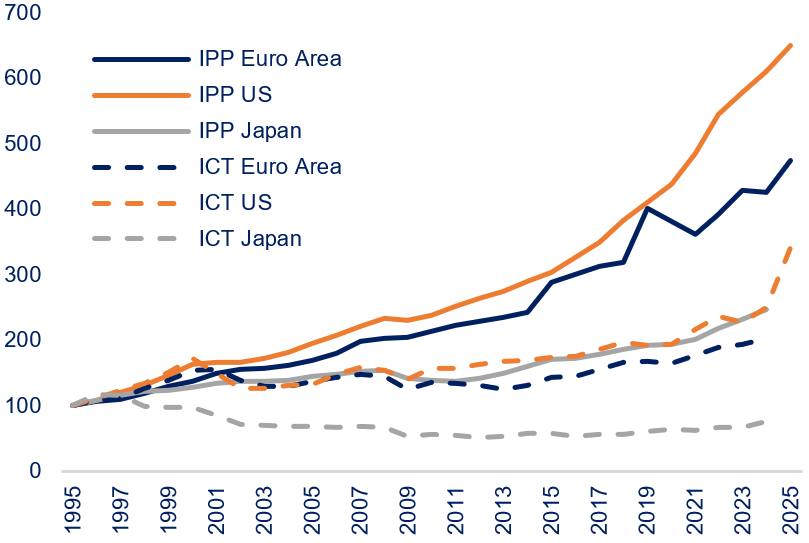
We note that investment discipline in the United States is not only strong but is also continuing to grow. The eurozone economies are not far behind, with rising investment in intellectual property. U.S. investment in IT and data storage infrastructure, through its “hyperscalers,” can be assessed in light of the projected 36% increase in investment in information and communication technologies by 2025.
The dynamics of value creation will also be determined by the magnitude and persistence of the inflationary shock, which is eroding real household incomes and corporate margins. This is particularly true in regions that are not energy self-sufficient. Geopolitical uncertainty has also led companies excluded from the technology investment supercycle to slow down their investment plans. In terms of consumption volumes, we estimate that U.S. households are better protected from the current shock than their European counterparts. This is due to the favorable tax measures introduced by the BBB (Big Beautiful Bill), which was passed last year. The positive wealth effect – characterized by these economic agents’ greater exposure to the performance of U.S. stock markets – is another factor that has historically contributed to the resilience of domestic demand across the Atlantic, particularly during temporary nominal shocks.
However, the responses of central banks, coupled with the tightening of financial conditions due to rising borrowing costs (both nominal and real), could slow the pace of domestic demand expansion in a context where governments’ fiscal space remains limited to counterbalance the aforementioned negative shock. However, we note that the responses of various central banks in major economies differ, and this is the subject of a separate note accompanying this publication. In contrast to the more restrictive stance adopted by the ECB throughout the year, the Fed’s neutral stance will amplify the divergences in growth trajectories on both sides of the Atlantic.
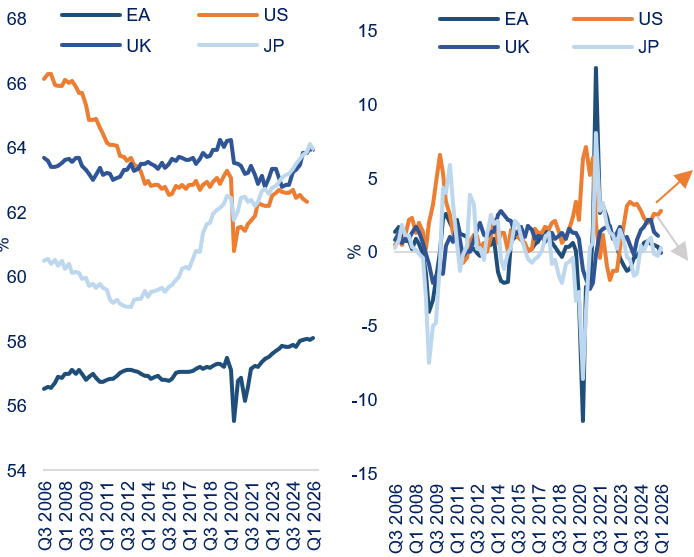
The trend in domestic demand will also depend on labor market dynamics and the balance between labor supply and demand, which could lead to an increase in household income. Figure 6 illustrates, from this perspective, contrasting situations on both sides of the Atlantic as well as in Japan. While the European and Japanese economies continue to rely heavily on the labor force, with higher labor force participation rates, structural fragility is beginning to emerge in the United States, confirming the hypothesis of a two-speed economy. Over the past few quarters, the proportion of the working-age population that is employed or actively seeking work has steadily declined. This phenomenon is all the more striking given that labor productivity in this economic region continues to buck the downward trend. For now, it is practically impossible to attribute this trend to the ongoing technological revolution. However, we can say that the measures to support productive investment implemented by various administrations since 2015, as well as the supply-side policy embodied by the Biden administration, appear to be bearing fruit. We see this as further evidence supporting the hypothesis that the U.S.’s potential growth – which is already higher than that of its developed counterparts in Europe and Asia – has likely received a positive boost in recent years. This confirms our view that the U.S. economy will continue to grow slightly above its potential in 2026, while growth in the eurozone and Japan is expected to remain modest due to limited fiscal room for maneuver, negative household and business confidence, and relatively cautious investment.
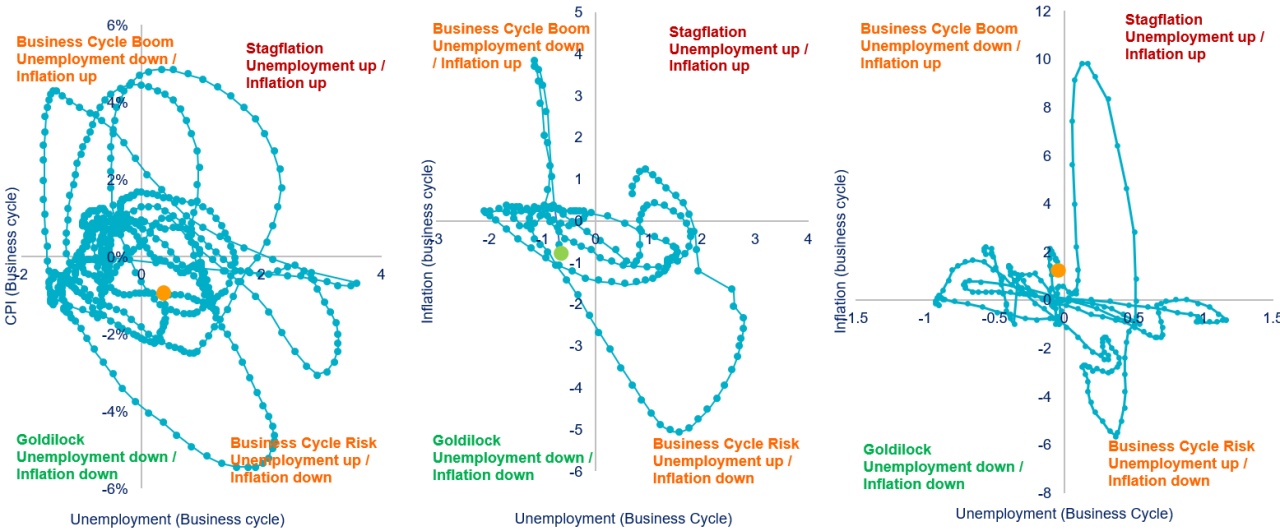
An alternative way for assessing the cyclical position of economies is to filter the cyclical component out of employment and price aggregates using signal frequency decomposition. This makes it possible to identify overheating or downturn regimes along these two axes.
Figure 7 summarises the positions of the US, European and Japanese economies within their respective economic cycles. As can be seen, each of these economies is in a different situation. According to this analytical framework:
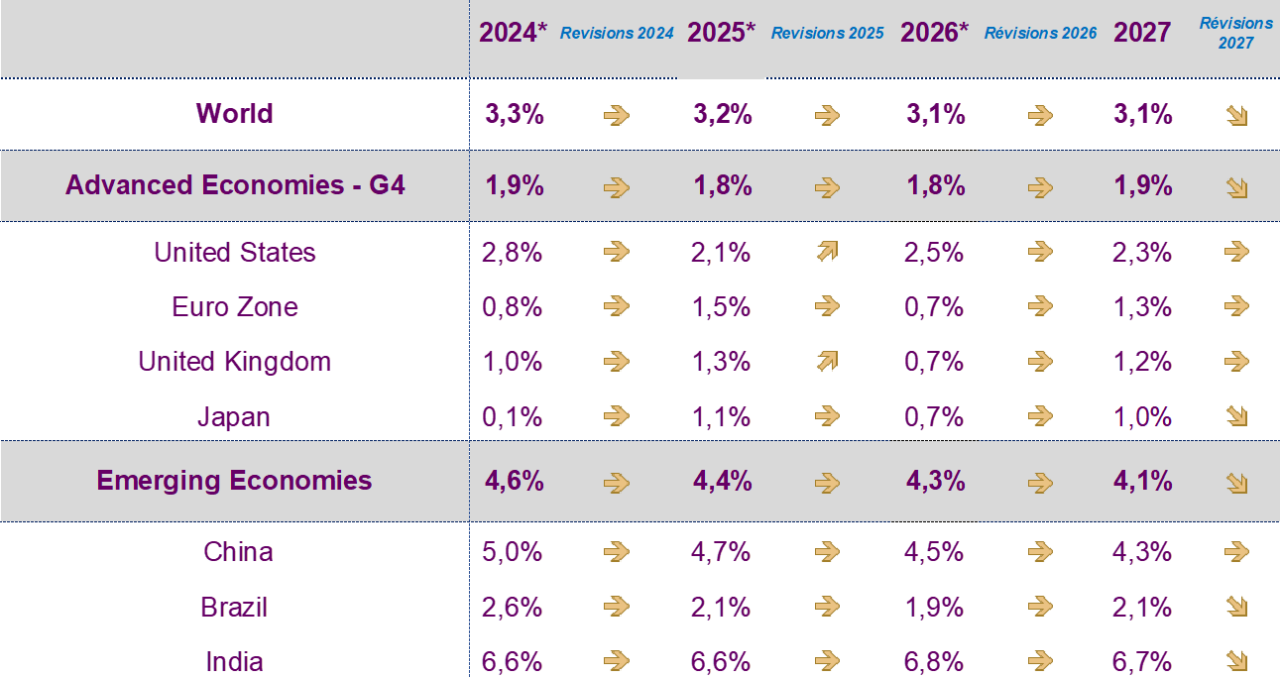
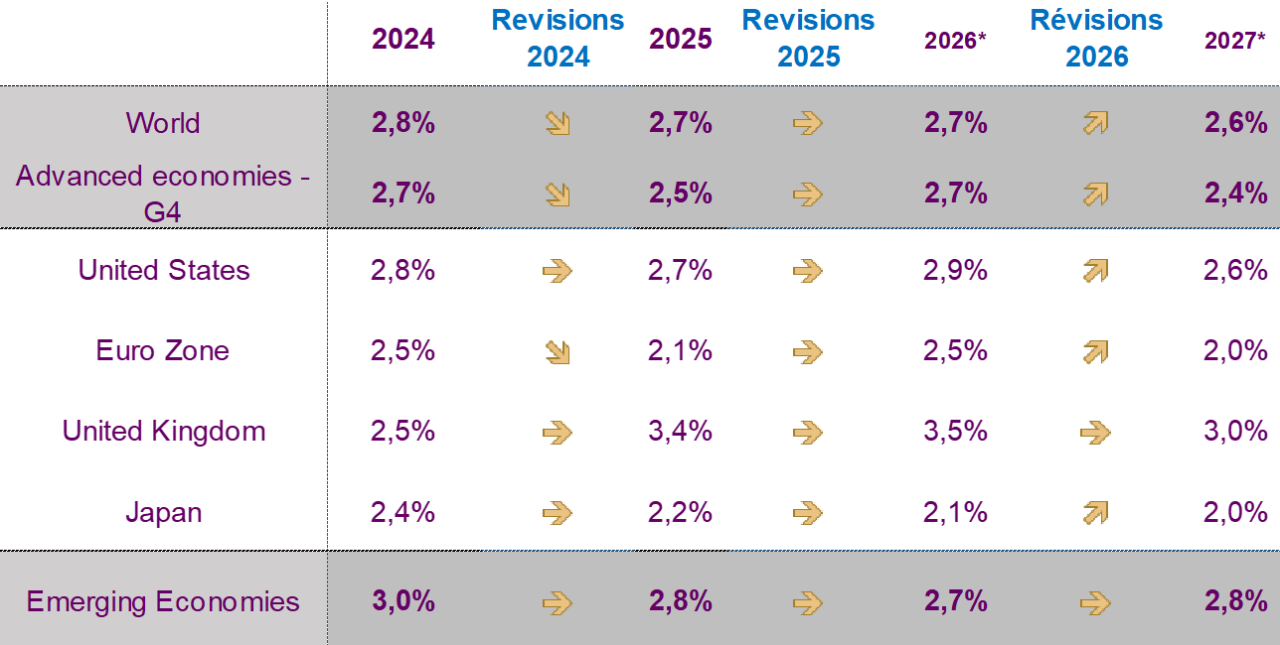
In 2026, we are likely to see a divergence in economic cycles (the US versus the rest of the world), with a possible reconvergence in 2027. However, sustained domestic demand in the US is expected to drive the Eurozone economy to some extent via the trade balance. Global growth is expected to remain close to 3 per cent. A dichotomy is expected to emerge in the developing world between economies that are exposed to new technologies and digital infrastructure and those that are not, with the latter suffering from a normalisation of commodity prices.
The inflation seen in the first half of the year, coupled with the conflict in the Middle East, is expected to stabilise until early 2027 as tensions ease and the pressure on supply chains decreases. While prices for certain categories of goods, particularly storage and computing capacity, are expected to continue rising, the bulk of underlying inflation is likely to remain contained as pass-throughs via wage pressures or the rationing of available goods and services are unlikely at this stage.
Written in July 2026


The securities mentioned above are shown for illustrative purpose only and should not be considered as a recommendation or a solicitation to buy or sell. The information provided reflects MIROVA’s opinion as of the date of this document and is subject to change without notice. The reported data reflect the situation as of the date of this document and are subject to change without notice. This information is intended for professional clients as defined by MiFID.
This material has been provided for information purposes only to investment service providers or other Professional Clients, Qualified or Institutional Investors and, when required by local regulation, only at their written request. This material must not be used with Retail Investors.
In the E.U.: Provided by Natixis Investment Managers International or one of its BRANCH offices listed below. Natixis Investment Managers International is a portfolio management company authorized by the Autorité des Marchés Financiers (French Financial Markets Authority - AMF) under no. GP 90-009, and a simplified joint-stock company (société par actions simplifiée - SAS) registered in the Paris Trade and Companies Register under no. 329 450 738, Registered office: 43 avenue Pierre Mendès France, 75013 Paris. Germany: Natixis Investment Managers International, Zweigniederlassung Deutschland (Registration number: HRB 129507). Registered office: Senckenberganlage 21, 60325 Frankfurt am Main. Italy: Natixis Investment Managers International Succursale Italiana (Registration number: MI-2637562). Registered office: Via Adalberto Catena, 4, 20121 Milan, Italy. Netherlands: Natixis Investment Managers International, Dutch BRANCH (Registration number: 000050438298), Registered office: Stadsplateau 7, 3521AZ Utrecht, the Netherlands. Spain: Natixis Investment Managers International S.A., Sucursal en España (Registration number: NIF W0232616C), Registered office: Serrano n°90, 6th Floor, 28006 Madrid, Spain. Luxembourg: Natixis Investment Managers International, Luxembourg BRANCH (Registration number: B283713), Registered office: 2, rue Jean Monnet, L-2180 Luxembourg, Grand Duchy of Luxembourg. Belgium: Natixis Investment Managers International, Belgian BRANCH (Registration number: 1006.931.462), Gare Maritime, Rue Picard 7, Bte 100, 1000 Bruxelles, Belgium.
In Switzerland: Provided for information purposes only by Natixis Investment Managers, Switzerland Sàrl (Registration number: CHE-114.271.882), Rue du Vieux Collège 10, 1204 Geneva, Switzerland or its representative office in Zurich, Schweizergasse 6, 8001 Zürich.
In the British Isles: Provided by Natixis Investment Managers UK Limited which is authorised and regulated by the UK Financial Conduct Authority (FCA firm reference no. 190258) - registered office: Natixis Investment Managers UK Limited, Level 4, Cannon Bridge House, 25 Dowgate Hill, London, EC4R 2YA. When permitted, the distribution of this material is intended to be made to persons as described as follows: in the United Kingdom: this material is intended to be communicated to and/or directed at investment professionals and professional investors only; in Ireland: this material is intended to be communicated to and/or directed at professional investors only; in Guernsey: this material is intended to be communicated to and/or directed at only financial services providers which hold a license from the Guernsey Financial Services Commission; in Jersey: this material is intended to be communicated to and/or directed at professional investors only; in the Isle of Man: this material is intended to be communicated to and/or directed at only financial services providers which hold a license from the Isle of Man Financial Services Authority or insurers authorised under section 8 of the Insurance Act 2008.
In the DIFC: Provided in and from the DIFC financial district by Natixis Investment Managers Middle East (DIFC BRANCH) which is regulated by the DFSA. Related financial products or services are only available to persons who have sufficient financial experience and understanding to participate in financial markets within the DIFC, and qualify as Professional Clients or Market Counterparties as defined by the DFSA. No other Person should act upon this material. Registered office: Unit L10-02, Level 10, ICD Brookfield Place, DIFC, PO Box 506752, Dubai, United Arab Emirates
In Japan: Provided by Natixis Investment Managers Japan Co., Ltd. Registration No.: Director-General of the Kanto Local Financial Bureau (kinsho) No.425. Content of Business: The Company conducts investment management business, investment advisory and agency business and Type II Financial Instruments Business as a Financial Instruments Business Operator.
In Taiwan: Provided by Natixis Investment Managers Securities Investment Consulting (Taipei) Co., Ltd., a Securities Investment Consulting Enterprise regulated by the Financial Supervisory Commission of the R.O.C. Registered address: 34F., No. 68, Sec. 5, Zhongxiao East Road, Xinyi Dist., Taipei City 11065, Taiwan (R.O.C.), license number 2020 FSC SICE No. 025, Tel. +886 2 8789 2788.
In Singapore: Provided by Natixis Investment Managers Singapore Limited (NIM Singapore) having office at 5 Shenton Way, #22-05/06, UIC Building, Singapore 068808 (Company Registration No. 199801044D) to distributors and qualified investors for information purpose only. NIM Singapore is regulated by the Monetary Authority of Singapore under a Capital Markets Services Licence to conduct fund management activities and is an exempt financial adviser. Mirova Division (Business Name Registration No.: 53431077W) and Ostrum Division (Business Name Registration No.: 53463468X) are part of NIM Singapore and are not separate legal entities. This advertisement or publication has not been reviewed by the Monetary Authority of Singapore.
In Hong Kong: Provided by Natixis Investment Managers Hong Kong Limited to professional investors for information purpose only.
In Australia: Provided by Natixis Investment Managers Australia Pty Limited (ABN 60 088 786 289) (AFSL No. 246830) and is intended for the general information of financial advisers and wholesale clients only.
In New Zealand: This document is intended for the general information of New Zealand wholesale investors only and does not constitute financial advice. This is not a regulated offer for the purposes of the Financial Markets Conduct Act 2013 (FMCA) and is only available to New Zealand investors who have certified that they meet the requirements in the FMCA for wholesale investors. Natixis Investment Managers Australia Pty Limited is not a registered financial service provider in New Zealand.
In Korea: Provided by Natixis Investment Managers Korea Limited (Registered with Financial Services Commission for General Private Collective Investment Business) to distributors and qualified investors for information purpose only.
In Colombia: Provided by Natixis Investment Managers International Oficina de Representación (Colombia) to professional clients for informational purposes only as permitted under Decree 2555 of 2010. Any products, services or investments referred to herein are rendered exclusively outside of Colombia. This material does not constitute a public offering in Colombia and is addressed to less than 100 specifically identified investors.
In Latin America: Provided by Natixis Investment Managers International.
In Chile: Esta oferta privada se inicia el día de la fecha de la presente comunicación. La presente oferta se acoge a la Norma de Carácter General N° 336 de la Superintendencia de Valores y Seguros de Chile. La presente oferta versa sobre valores no inscritos en el Registro de Valores o en el Registro de Valores Extranjeros que lleva la Superintendencia de Valores y Seguros, por lo que los valores sobre los cuales ésta versa, no están sujetos a su fiscalización. Que por tratarse de valores no inscritos, no existe la obligación por parte del emisor de entregar en Chile información pública respecto de estos valores. Estos valores no podrán ser objeto de oferta pública mientras no sean inscritos en el Registro de Valores correspondiente.
In Mexico: Provided by Natixis IM Mexico, S. de R.L. de C.V., which is not a regulated financial entity, securities intermediary, or an investment manager in terms of the Mexican Securities Market Law (Ley del Mercado de Valores) and is not registered with the Comisión Nacional Bancaria y de Valores (CNBV) or any other Mexican authority. Any products, services or investments referred to herein that require authorization or license are rendered exclusively outside of Mexico. While shares of certain ETFs may be listed in the Sistema Internacional de Cotizaciones (SIC), such listing does not represent a public offering of securities in Mexico, and therefore the accuracy of this information has not been confirmed by the CNBV. Natixis Investment Managers is an entity organized under the laws of France and is not authorized by or registered with the CNBV or any other Mexican authority. Any reference contained herein to “Investment Managers” is made to Natixis Investment Managers and/or any of its investment management subsidiaries, which are also not authorized by or registered with the CNBV or any other Mexican authority.
In Uruguay: Provided by Natixis Investment Managers Uruguay S.A. Office: San Lucar 1491, Montevideo, Uruguay, CP 11500. The sale or offer of any units of a fund qualifies as a private placement pursuant to section 2 of Uruguayan law 18,627.
In Brazil: Provided to a specific identified investment professional for information purposes only by Natixis Investment Managers International. This communication cannot be distributed other than to the identified addressee. Further, this communication should not be construed as a public offer of any securities or any related financial instruments. Natixis Investment Managers International is a portfolio management company authorized by the Autorité des Marchés Financiers (French Financial Markets Authority - AMF) under no. GP 90-009, and a simplified joint-stock company (société par actions simplifiée - SAS) registered in the Paris Trade and Companies Register under no. 329 450 738. Registered office: 43 avenue Pierre Mendès France, 75013 Paris.
The above referenced entities are business development units of Natixis Investment Managers, the holding company of a diverse line-up of specialised investment management and distribution entities worldwide. The investment management subsidiaries of Natixis Investment Managers conduct any regulated activities only in and from the jurisdictions in which they are licensed or authorized. Their services and the products they manage are not available to all investors in all jurisdictions.
Although Natixis Investment Managers believes the information provided in this material to be reliable, including that from third party sources, it does not guarantee the accuracy, adequacy, or completeness of such information.
The provision of this material and/or reference to specific securities, sectors, or markets within this material does not constitute investment advice, or a recommendation or an offer to buy or to sell any security, or an offer of any regulated financial activity. Investors should consider the investment objectives, risks and expenses of any investment carefully before investing. The analyses, opinions, and certain of the investment themes and processes referenced herein represent the views of the individual(s) as of the date indicated. These, as well as the portfolio holdings and characteristics shown, are subject to change and cannot be construed as having any contractual value. There can be no assurance that developments will transpire as may be forecasted in this material. The analyses and opinions expressed by external third parties are independent and does not necessarily reflect those of Natixis Investment Managers. Any past performance information presented is not indicative of future performance.
This material may not be distributed, published, or reproduced, in whole or in part.
All amounts shown are expressed in USD unless otherwise indicated.