
Midyear Recap: Portfolios Back in Business?
Latin American & US Offshore Advisors Portfolio Barometer
FIRST HALF 2023
The Natixis Investment Managers Portfolio Barometer offers insights into Latin American & US Offshore financial advisors’ model portfolios and the allocation decisions they are making. Our Portfolio Clarity team of dedicated consultants works directly with financial advisors and other intermediaries to analyze and enhance their understanding of the sources of risk, return and diversification in their portfolios. This report examines trends in the markets and in advisors’ moderate model portfolios in the first half of 2023.
Resource
Portfolio Barometer – Summer 2023
Download PDF
Midyear recap: Back in business?
After a disappointing 2022, markets experienced an impressive turnaround in the first half of2023. Most notably:
- The Nasdaq Composite delivered 32%, its best first half in 40 years.
- Big tech wins also led the S&P 500® to a nearly 17% gain.
- Bonds, as measured by the Bloomberg US Aggregate Bond Index, were up just over 2%.
So, what have wealth managers’ portfolios been telling us?
- Advisors weren’t quite ready to jump back into stocks. Allocations to equities declined over the first six months of the year, while fixed income weights increased.
- This is the year of fixed income. Trends include locking in yield and extending duration.
- Risk appetite was low, but risk taking paid off. The portfolios in the top performance quartile were those with the highest equity exposure (47% on average).
- The 60/40 portfolio is working again. The negative correlation between stocks and bonds is back to its historical average.
- Resurgence in active management. Advisors tilted towards active strategies over the first half of the year.
Risk appetite remained muted
Although inflation declined and equity markets responded with better returns, the average Moderate Model Portfolio still favored bonds over stocks as of June 30, 2023 (Figure 1). Investors seemed to be taking a wait-and-see attitude as they evaluated potential opportunities.1) Changes to asset allocation over the first half of the year (December 31, 2022 – June 30, 2023)
- Equities fell from 44% to 41%.
- Bonds increased from 46% to 49%.
- Cash increased to 2.6% from 0.9%.
FIGURE 1: Average Allocations in Moderate Model Portfolio as of June 30, 2023
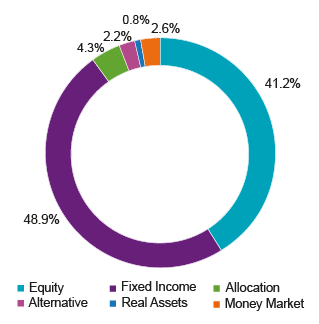
| Equity | 41.2% |
| Fixed Income | 48.9% |
| Allocation | 4.3% |
| Alternative | 2.2% |
| Real Assets | 0.8% |
| Money Market | 2.6% |
| Grand Total | 100.0% |
2) Lower risk profile
By the end of the first half, we saw rolling 12-month volatility (Figure 2) fall below the 12% level reached during Q422 and reach 11.6%, evidencing the more amenable market environment.
FIGURE 2: 12-Month Rolling Volatility as of June 30, 2023
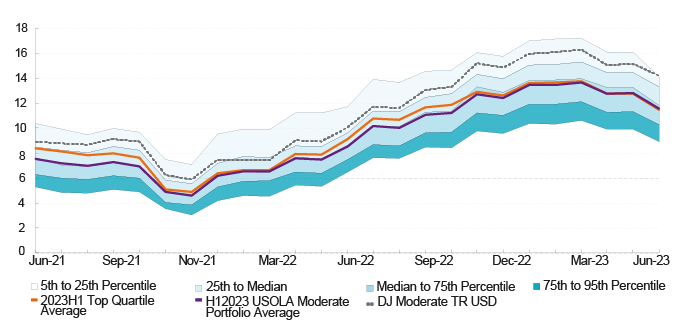
Source: Natixis Investment Managers Solutions, Morningstar
Amid lower risk appetite, the model portfolios analyzed also exhibited a lower downside risk profile than the DJ Moderate Index (Figure 3).
FIGURE 3: Downside Risk as of June 30, 2023
| Three-Year VaR (%) | Three-Year Max Drawdown (%) | |
|---|---|---|
| Top Quartile Portfolio Average | 5.67% | -16.03% |
| Average Moderate Model Portfolio | 5.34% | -18.08% |
| Dow Jones Moderate Portfolio Index | 6.20% | -20.38% |
3) Asset allocators maintained their faith in diversification
The average number of funds and ETFs in the moderate model portfolios analyzed by the Natixis Portfolio Clarity team increased over the first six months of the year, from 19 to 24. Only closer analysis of each portfolio would indicate whether additional holdings actually lowered risk.
2023: The year of fixed income
Asset allocators shifted their approach to fixed income as they continued to reassess the opportunities brought by higher rates. Throughout the first half, allocations gradually shifted away from short-term fixed income and moved further out the curve into longer duration assets.FIGURE 4: Fixed Income Allocation Changes in Moderate Portfolios by Morningstar Category, 2H2022–1H2023
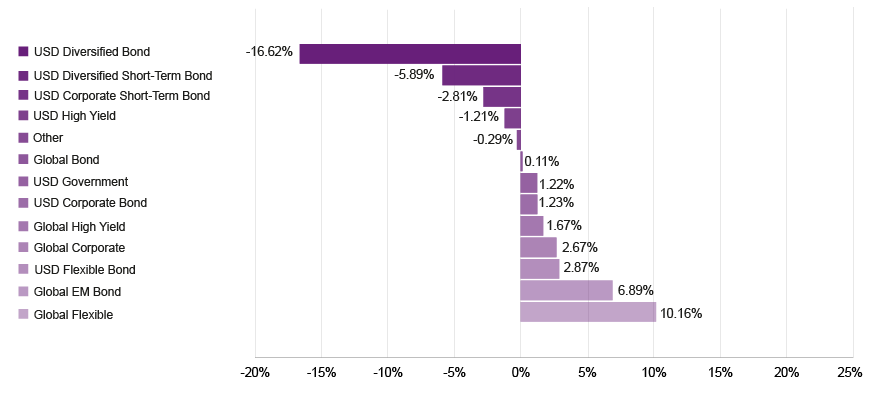
Source: Natixis Investment Managers Solutions, Morningstar
The allocation to Global Flexible strategies increased to 25%, largely at the expense of North American focused funds, which were reduced from 28% to 22%. Appetite for emerging market debt was also strong, with allocations increasing from 3% to 10%, supported by US dollar weakness and rating upgrades. While risk-adjusted returns would seem to favor credit, investors are cautious about potential defaults (especially in high yield) and only marginally increased these allocations.
Higher risk, higher reward
1) Equity exposure drove returnsAdvisors generally decreased their equity exposure during the first half but, unsurprisingly, the best year-to-date and one-year performance came from model portfolios with the highest equity allocations. While the average moderate portfolio outpaced the benchmark by 126 bps for the one-year period to June 30, top quartile portfolios outperformed by between 200 and 700 bps (Figure 5).
FIGURE 5: Average Moderate Model Portfolio Annualized Performance as of June 30, 2023
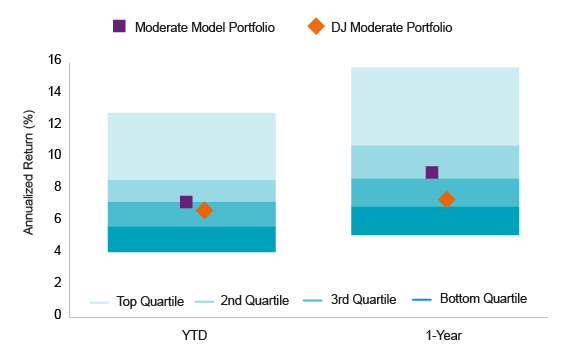
| Equity Exposure | Bond Exposure | Year to Date (%) | One-Year (%) | Three-Year (%) | |
|---|---|---|---|---|---|
| Top Quartile Portfolio Average | 46.9% | 41.3% | 9.21% | 11.26% | 7.56% |
| Average Moderate Model Portfolio | 41.2% | 48.9% | 7.53% | 9.26% | 4.45% |
| Dow Jones Moderate Portfolio Index | 50.0% | 50.0%* | 6.99% | 8.00% | 5.06% |
2) A deeper look into the equity allocation
As seen in Figure 6, North American Equity was the dominant region across the average portfolio, followed by Global Equity. In addition, positions within North American Equity were tilted towards growth strategies and large-cap stocks, which paid off in the first half as brighter prospects for a soft landing in the US led these sectors of the market to outperform.
FIGURE 6: Equity Allocation Regional Breakdown
| Global Equity | 12.1% |
| North American Equity | 17.1% |
| Europe Equity | 1.7% |
| EM Equity | 3.8% |
| Other Equity | 6.5% |
The 60/40 portfolio is back…
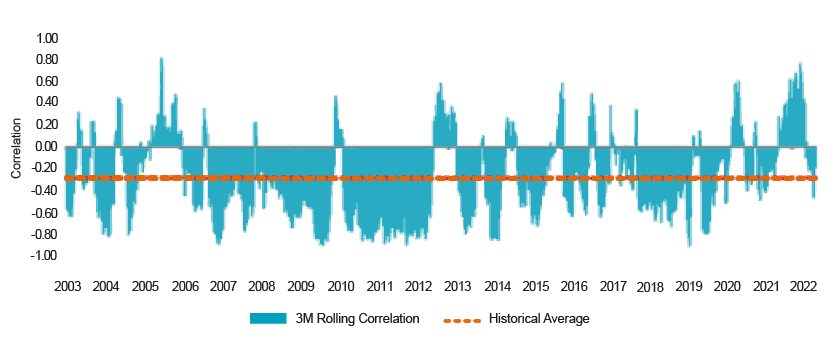
1) The 60/40 portfolio is making a comebackReturns have been strong this year and the negative correlation between stocks and bonds has returned to its historical average (Figure 7), breathing life back into the traditional allocation strategy. With inflation better under control, the forces pushing bond yields higher – and stocks lower – have eased, and duration positions may once again offer an offset to equity risk.
FIGURE 7: The Negative Correlation Between Stocks and Bonds Is Back
Equity-Treasury Correlation October 31, 2003 – June 20, 2023
Source: Natixis Investment Managers Solutions
2) Appetite for diversifiers
Just under a third of advisors turned to alternative strategies to manage risk and add sources of non-correlated return to their moderate portfolios. Allocation to alternatives in the top quartile of models was 3.2% on June 30 (1% higher than the average model), with a preference for absolute return and uncorrelated fixed income strategies. Advisors also maintained some exposure to Commodities, including Gold, for additional diversification.*
Resurgence in active management
After years of easy money, fixed income market dynamics are changing quickly. While there may be attractive opportunities in longer duration bonds and corporate credit, potential defaults are a growing concern for investors. In this environment, advisors are counting on active managers to bring their experience and expertise to the challenges of bottom-up security selection, as evidenced by a tilt towards active strategies within fixed income allocations (84.8%). Advisors also turned to active management in equities, as narrow market breadth during the first half provided opportunities for experienced stock pickers (77.9% vs 22.1% in index strategies).PORTFOLIO ANALYSIS AND CONSULTING
The past year has shown how quickly the investment environment can change and how challenging it can be to account for market risk and potential rewards in portfolio allocation. If you would like to have your model portfolio reviewed to identify sources of return, diversification, and risk, please contact your Natixis Investment Managers Sales Representatives.Methodology
All figures, unless otherwise stated, are derived from detailed analysis conducted by the portfolio consultants at Natixis Investment Managers.
This edition of the Portfolio Barometer highlights trends and observations uncovered by analysis of 56 risk-rated model portfolios managed by Latin American & US Offshore financial advisors and wealth management firms in the six months ending June 30, 2023 as well as 17 risk-rated model portfolios managed by Latin American & US Offshore financial advisors and wealth management firms in the six months ending December 31, 2022. The model portfolios under review were defined as Moderate Risk by the firms submitting them. All statistics in this report are based on returns of advisors’ current model portfolios over the three years ending June 30, 2023. These statistics are therefore representative, rather than actual historical figures. The dedicated consulting team collects portfolio data and aggregates it in accordance with the peer group portfolio category that is assigned to an individual portfolio by the investment professionals. When professionals request a report, they categorize the portfolios as belonging to one of the following categories: Aggressive, Moderately Aggressive, Moderate, Moderately Conservative, or Conservative. The categorization of individual portfolios is not determined by Natixis, as our role is solely as an aggregator of the pre-categorized portfolios. The Dow Jones Moderate Portfolio Index is used as the benchmark for the Latin American & US Offshore moderate peer group average due to its similar risk profile and investment universe as the peer group. Please note that risk attributes of portfolios will change over time due to movements in the capital markets. Portfolio allocations provided to Natixis are static in nature, and subsequent changes in an investment professional’s portfolio allocations may not be reflected in the current data.
This communication is for information only and is intended for investment service providers or other Professional Clients. This material must not be used with Retail Investors. This material may not be redistributed, published, or reproduced, in whole or in part.
Past performance is no guarantee of, and not necessarily indicative of, future results.
All investing involves risk, including the risk of loss. No investment strategy or risk management technique can guarantee return or eliminate risk in all market environments. Investment risk exists with equity, fixed income, and alternative investments. There is no assurance that any investment will meet its performance objectives or that losses will be avoided.
The analyses and opinions referenced herein represent the subjective views of the author as referenced, and are as of 6/30/23. These, as well as the portfolio holdings and characteristics shown, are subject to change. There can be no assurance that developments will transpire as may be forecasted in this material. Past performance information presented is not indicative of future performance.
In Latin America: Provided to Professional Clients for information purposes only by Natixis Investment Managers International. Natixis Investment Managers International is a portfolio management company authorized by the Autorité des Marchés Financiers (French Financial Markets Authority - AMF) under no. GP 90-009, and a public limited company (société anonyme) registered in the Paris Trade and Companies Register under no. 329 450 738. Registered office: 43 avenue Pierre Mendès France, 75013 Paris. In Uruguay: Provided by Natixis Investment Managers Uruguay S.A., a duly registered investment advisor, authorized and supervised by the Central Bank of Uruguay. Office: San Lucar 1491, Montevideo, Uruguay, CP 11500. The sale or offer of any units of a fund qualifies as a private placement pursuant to section 2 of Uruguayan law 18,627. In Colombia: Provided by Natixis Investment Managers International Oficina de Representación (Colombia) to professional clients for informational purposes only as permitted under Decree 2555 of 2010. Any products, services or investments referred to herein are rendered exclusively outside of Colombia. This material does not constitute a public offering in Colombia and is addressed to less than 100 specifically identified investors. In Mexico: Provided by Natixis IM Mexico, S. de R.L. de C.V., which is not a regulated financial entity, securities intermediary, or an investment manager in terms of the Mexican Securities Market Law (Ley del Mercado de Valores) and is not registered with the Comisión Nacional Bancaria y de Valores (CNBV) or any other Mexican authority. Any products, services or investments referred to herein that require authorization or license are rendered exclusively outside of Mexico. While shares of certain ETFs may be listed in the Sistema Internacional Cotizaciones (SIC), such listing does not represent a public offering of securities in Mexico, and therefore the accuracy of this information has not been confirmed by the CNBV. Natixis Investment Managers is an entity organized under the laws of France and is not authorized by or registered with the CNBV or any other Mexican authority. Any reference contained herein to “Investment Managers” is made to Natixis Investment Managers and/or any of its investment management subsidiaries, which are also not authorized by or registered with the CNBV or any other Mexican authority.
The above referenced entities are business development units of Natixis Investment Managers, the holding company of a diverse lineup of specialized investment management and distribution entities worldwide. The investment management subsidiaries of Natixis Investment Managers conduct any regulated activities only in and from the jurisdictions in which they are licensed or authorized. Their services and the products they manage are not available to all investors in all jurisdictions.
In the United States: Provided by Natixis Distribution, LLC, 888 Boylston St., Boston, MA 02199. For U.S. financial advisors who do business with investors who are not U.S. Persons (as that term is used in Regulation S under the Securities Act of 1933) or persons otherwise present in the U.S. It may not be redistributed to U.S. Persons or persons present in the U.S. Natixis Investment Managers includes all of the investment management and distribution entities affiliated with Natixis Distribution, LLC and Natixis Investment Managers S.A.
The provision of this material and/or reference to specific securities, sectors, or markets within this material does not constitute investment advice, or a recommendation or an offer to buy or to sell any security, or an offer of any regulated financial activity. Investors should consider the investment objectives, risks and expenses of any investment carefully before investing. This document is provided for informational purposes only and should not be construed as investment advice. Although Natixis Investment Managers believes the information provided in this material to be reliable, including that from third party sources, it does not guarantee the accuracy, adequacy, or completeness of such information.
This material may not be distributed, published, or reproduced, in whole or in part.
This document may contain references to copyrights, indexes, and trademarks, each of which is the property of its respective owner and may not be registered in all jurisdictions. Such owners are not affiliated with Natixis Investment Managers or any of its related or affiliated companies (collectively “Natixis”), and do not sponsor, endorse or participate in the provision of any Natixis services, funds or other financial products.
The index information contained herein is derived from third parties and is provided on an “as is” basis. The user of this information assumes the entire risk of use of this information. Each of the third party entities involved in compiling, computing or creating index information disclaims all warranties (including, without limitation, any warranties of originality, accuracy, completeness, timeliness, non-infringement, merchantability and fitness for a particular purpose) with respect to such information.
FOR FINANCIAL PROFESSIONALS ONLY
5882478.1.1


 Economic and Financial Outlook 2024