


Three Reasons to Stay Invested in Volatile Times
1. Markets Have Historically Been Resilient: Despite facing decade after decade of wars, virus outbreaks, natural disasters, recessions, and financial crisis, markets continued to climb higher over the past 30 years. Consider how these hypothetical $10,000 investments allocated to stocks and bonds grew over 30 years, ending 3/31/2023.
Cumulative Growth of $10,000
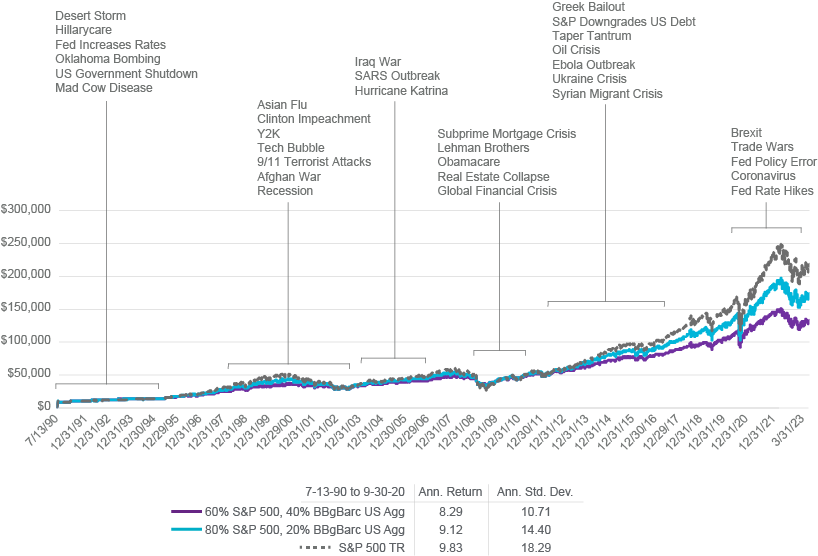
For illustrative purposes only. Periods chosen are based on start of drawdown to maximum drawdown and recovery period. Indexes are not investments, do not incur fees and expenses, and are not professionally managed. It is not possible to invest directly in an index. Past performance is no guarantee of, and not necessarily indicative of, future results.
Source: Natixis Portfolio Research & Consulting Group (PRCG), FactSet
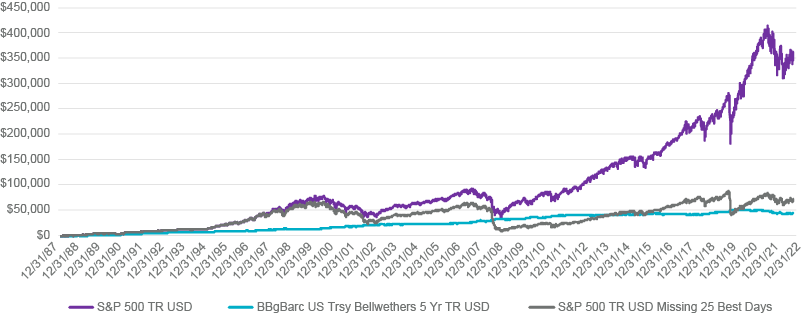
25 Best Days for S&P 500 TR USD between 12/31/1987 and 12/31/2022. For illustrative purposes only. Indexes are not investments, do not incur fees and expenses, and are not professionally managed. It is not possible to invest directly in an index. Past performance is no guarantee of, and not necessarily indicative of, future results.
Source: Natixis Portfolio Research & Consulting Group (PRCG), Morningstar MPI.
| Quarter Ending | Quarterly Return (%) | 1 Year After (%) | 3 Years After (%) | 5 Years After (%) |
|---|---|---|---|---|
| September 1974 | -25.0 | 38.1 | 72.7 | 117.3 |
| December 1987 | -22.5 | 16.6 | 48.8 | 108.9 |
| December 2008 | -21.9 | 26.5 | 48.6 | 128.2 |
| December 1937 | -21.1 | 30.8 | 17.5 | 24.9 |
| June 1962 | -20.6 | 31.1 | 69.1 | 94.7 |
| March 2020 | -19.6 | 56.4 | 66.8 | — |
| March 1938 | -19.0 | 34.8 | 37.6 | 83.5 |
| September 1946 | -18.0 | 6.3 | 24.1 | 114.2 |
| June 1970 | -18.0 | 41.7 | 57.1 | 56.2 |
| September 2002 | -17.3 | 24.4 | 59.0 | 105.1 |
| June 1940 | -16.5 | 5.5 | 50.6 | 101.2 |
| March 1939 | -16.4 | 17.6 | -11.7 | 48.7 |
| June 2022 | -16.1 | — | — | — |
| September 2001 | -14.7 | -20.5 | 12.6 | 40.1 |
| September 2011 | -13.9 | 30.2 | 86.1 | 113.4 |
| September 1990 | -13.7 | 31.2 | 64.6 | 121.4 |
| December 2018 | -13.5 | 31.5 | 100.4 | — |
| June 2002 | -13.4 | 0.3 | 27.0 | 66.3 |
| December 1941 | -12.6 | 20.1 | 80.4 | 126.2 |
| June 1937 | -12.6 | -19.9 | -23.5 | -26.7 |
| March 2001 | -11.9 | 0.2 | 1.9 | 21.5 |
| June 2010 | -11.4 | 30.7 | 66.2 | 122.5 |
| March 2009 | -11.0 | 49.8 | 88.0 | 161.1 |
| September 1975 | -10.9 | 30.4 | 39.9 | 90.6 |
| September 1981 | -10.9 | 9.9 | 65.9 | 150.0 |
| Averages | 21.8 | 47.9 | 89.5 | |
| % of Times Stocks were Higher | 92% | 92% | 95% | |
Source: Natixis PRCG. Morningstar, MPI. Performance data shown represents past performance and is no guarantee of, and not necessarily indicative of, future results.
3. Time Is on Your Side: As a long-term investor, it’s wise to remember that it’s not a “timing” issue, it’s just an issue of time. Consider how staying invested over the long term has historically added up. This hypothetical $100,000 investment in the S&P 500® Index over 30 years, ending 12/31/2022, grew significantly – despite several volatile short-term market events.
$100,000 Hypothetical Investment in the S&P 500 Index over 30 Years
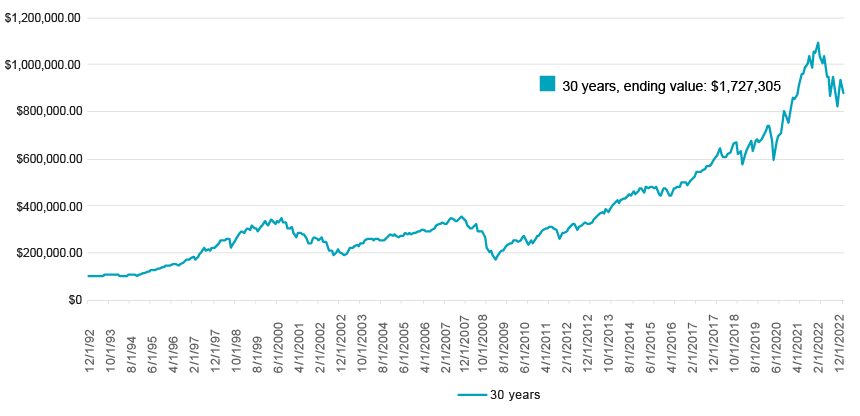
The chart reflects the hypothetical investment of $100,000 in the S&P 500 for 30-year periods ending December 31, 2022. For illustrative purposes only. Indexes are not investments, do not incur fees and expenses, and are not professionally managed. It is not possible to invest directly in an index. Data shown represents past performance and is no guarantee of, and not necessarily indicative of, future results.
Source: Natixis Portfolio Research & Consulting Group (PRCG), FactSet
Bloomberg Barclays U.S. Aggregate Index is an unmanaged index that covers the US-dollar-denominated, investment-grade, fixed-rate, taxable bond market of SEC-registered securities. The index includes bonds from the Treasury, government-related, corporate, mortgage-backed securities, asset-backed securities, and collateralized mortgage-backed securities sectors.
All investing involves risk, including the risk of loss. Investment risk exists with equity, fixed income and alternative investments. There is no assurance that any investment will meet its performance objectives or that losses will be avoided.
3008342.5.2
 Why Everyone’s Talking About… Market Bubbles
 Equities: How worried should we be about valuations?

 Why Investing in Innovation Goes Beyond the Magnificent Seven
