Meaningful Distinctions: Emerging Market Corporate Bonds Versus Emerging Market Sovereigns
July 07, 2026
-
4 min

Capabilities
Find
out more about our investment capabilities
Services
Find out more about the full scope of our solutions offering

Funds
Search for funds, documents, and notifications
Funds by asset class
Search for funds within each asset class
Funds by investment manager
Find funds run by each of our affiliated investment managers
Insights by asset class
Gain our perspectives and investment thinking across each asset class
News and insights
Get deep insight and expert views on the forces shaping financial markets

Who we are
Find out more about who we are and how we might be able to help
Investor sentiment
Discover the latest insights from the center for investor insight


Emerging market (EM) credit, a general catchall phrase, merges together two distinct investment opportunity sets, EM sovereigns and EM corporates. Lately, emerging market corporates have attracted growing investor interest by offering enhanced diversification potential, an up-in-quality opportunity set, spread premiums, and strong absolute and risk-adjusted long-term returns relative to the EM sovereign universe.
EM corporates have also benefited from the recent sovereign upgrade cycle, which has eased pressure from the sovereign ratings cap on corporate issuers. Additionally, the global AI capex cycle has supercharged growth for Asia’s manufacturing base and lifted structural demand for emerging market energy exporters and metals producers.
The EM hard currency corporate universe, currently at $2.6 trillion, is now 1.4x larger than the EM sovereign universe.[1] We believe the breadth of EM corporate securities, over 800 issuers across more than 65 countries,[2] presents greater opportunities for research-based security selection and enhanced portfolio diversification. The corporate universe provides diversified exposure across sectors, with new issuance offering access to evolving investment. Notably, EM corporates have become increasingly less reliant on demand from developed markets as trade between emerging economies has increased in recent years. EM-to-EM trades have helped corporates become more resilient to shifting macroeconomic regimes, in our view.
When comparing the EM sovereign and EM corporate indices, the EM corporate index is rated one notch higher. Notably, the EM corporate universe has a robust investment grade opportunity set, with nearly 60% of the index rated investment grade (IG) (+12% versus the sovereign IG segment). As a result, the EM Corporate IG segment carries a Baa1 average quality rating versus EM IG Sovereigns at Baa2. Within the high yield segment emerging market sovereign investors also face a challenge, significant index concentration in the lowest-rated segment. Nearly 10% of the EM sovereign index is held in the CCC and lower ratings category. While this exposure can offer meaningful return potential, it can also amplify volatility and sensitivity to shifts in investor sentiment, in our view.
|
|
|
|
|---|---|---|
|
|
|
|
|
|
|
|
|
|
|
|
|
|
|
|
|
|
|
|
|
|
|
|
|
|
|
|
|
|
|
|
|
|
|
|
|
|
|
|
|
|
|
|
|
|
|
|
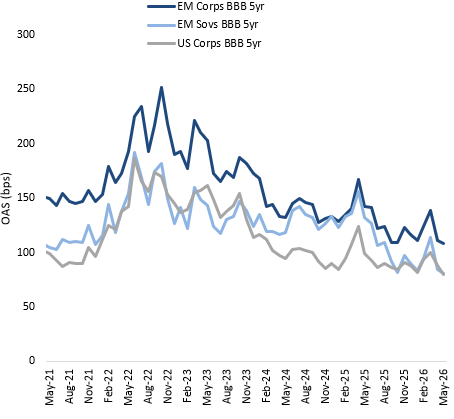
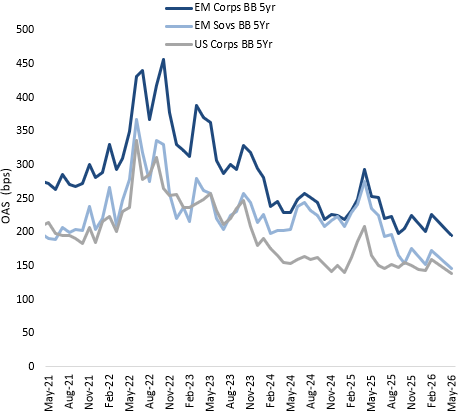
On a ratings and duration-adjusted basis, the EM corporate credit sector has offered a persistent spread premium compared with that of developed market and EM sovereign peers (see charts below). The excess premium typically offered by EM corporate credit has the potential to translate into higher returns. As most bond investors know, yields can drive long-term returns in fixed income.
Historically, the EM corporate asset class has been dominated by sizable, geographically diverse institutional buyers. JP Morgan estimates that local investors hold more than 50% of the EM corporate asset class, providing a stable ownership base during periods of market volatility.
Limited retail participation is also a key consideration. Using the ETF market as a proxy for retail investing, we see EM corporate ETFs are far fewer and smaller on a market-capitalization basis than their EM sovereign ETF counter parts3 Lower relative retail participation and higher institutional ownership can provide a supportive dynamic when outflow pressures contribute to choppy prices.
Examining performance over the past 10 years, EM corporates outperform EM sovereigns across key measures, with the space offering higher returns, lower volatility, a higher Sharpe ratio and lower drawdown.
|
|
|
|
|
|
|---|---|---|---|---|
|
|
|
|
|
|
|
|
|
|
|
|
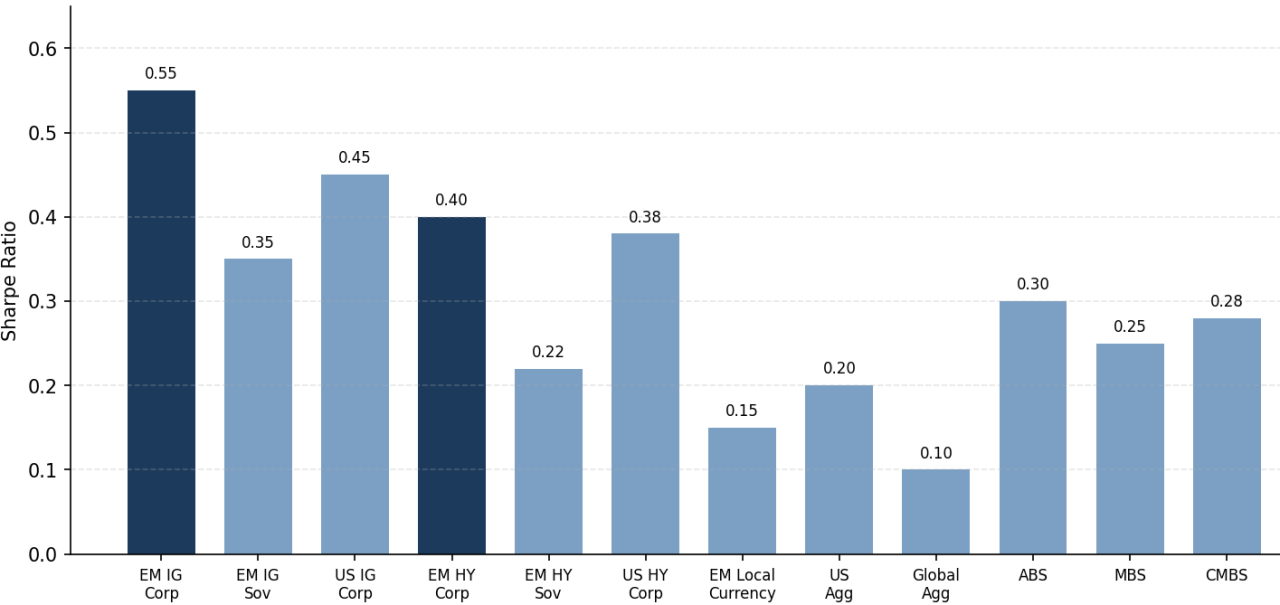
We believe the factors discussed above support the attractive risk-adjusted returns of the EM corporate sector. Importantly, comparing EM corporates to a broader fixed income universe, the asset class remains a top performer.
We do see times when sovereigns offer value in an EM corporate portfolio. Our exposure to EM sovereigns across our various EM corporate strategies is generally under 5%. The following three reasons primarily drive our allocations to sovereigns:
Diversification does not ensure a profit or guarantee against a loss.
Any investment that has the possibility for profits also has the possibility of losses, including the loss of principal.
There is no guarantee that the investment objective will be realized or that the strategy will generate positive or excess return.
Footnotes:
1 Source: JP Morgan, as of June 2026. Note that this figure is the representative universe and it does reflect the market value of indices.
2 Sources: The JP Morgan CEMBI Broad Diversified Core Index and the JP Morgan Asia Credit Index (JACI), as of June 2026.
3 Source: Bloomberg, as of June 2026.
Disclosures
Marketing communication. This material is provided for informational purposes only and should not be construed as investment advice. Views expressed in this article as of the date indicated are subject to change and there can be no assurance that developments will transpire as may be forecasted in this article. All investing involves risk, including the risk of capital loss. No investment strategy or risk management technique can guarantee return or eliminate risk in all market environments. Investment risk exists with equity, fixed income, and alternative investments. There is no assurance that any investment will meet its performance objectives or that losses will be avoided. Any past performance information presented is not indicative of future performance.
In the UK: Please read the Prospectus and Key Investor Information Document carefully before investing.
In the EEA: Please read the Prospectus and Key Information Document carefully before investing. To obtain a summary of investor rights in the official language of your jurisdiction, please select the appropriate country/your location and then consult the legal documentation section of the website.
For Other Countries/Regions: Please read the relevant offering documents carefully before investing.
This material may not be redistributed, published, or reproduced, in whole or in part.

?qlt=85&ts=1777555264152&dpr=off&fmt=webp-alpha&fit=constrain "Fixed Income Compass - Ostrum AM – April 2026")